Turning complex data into usable visualisations
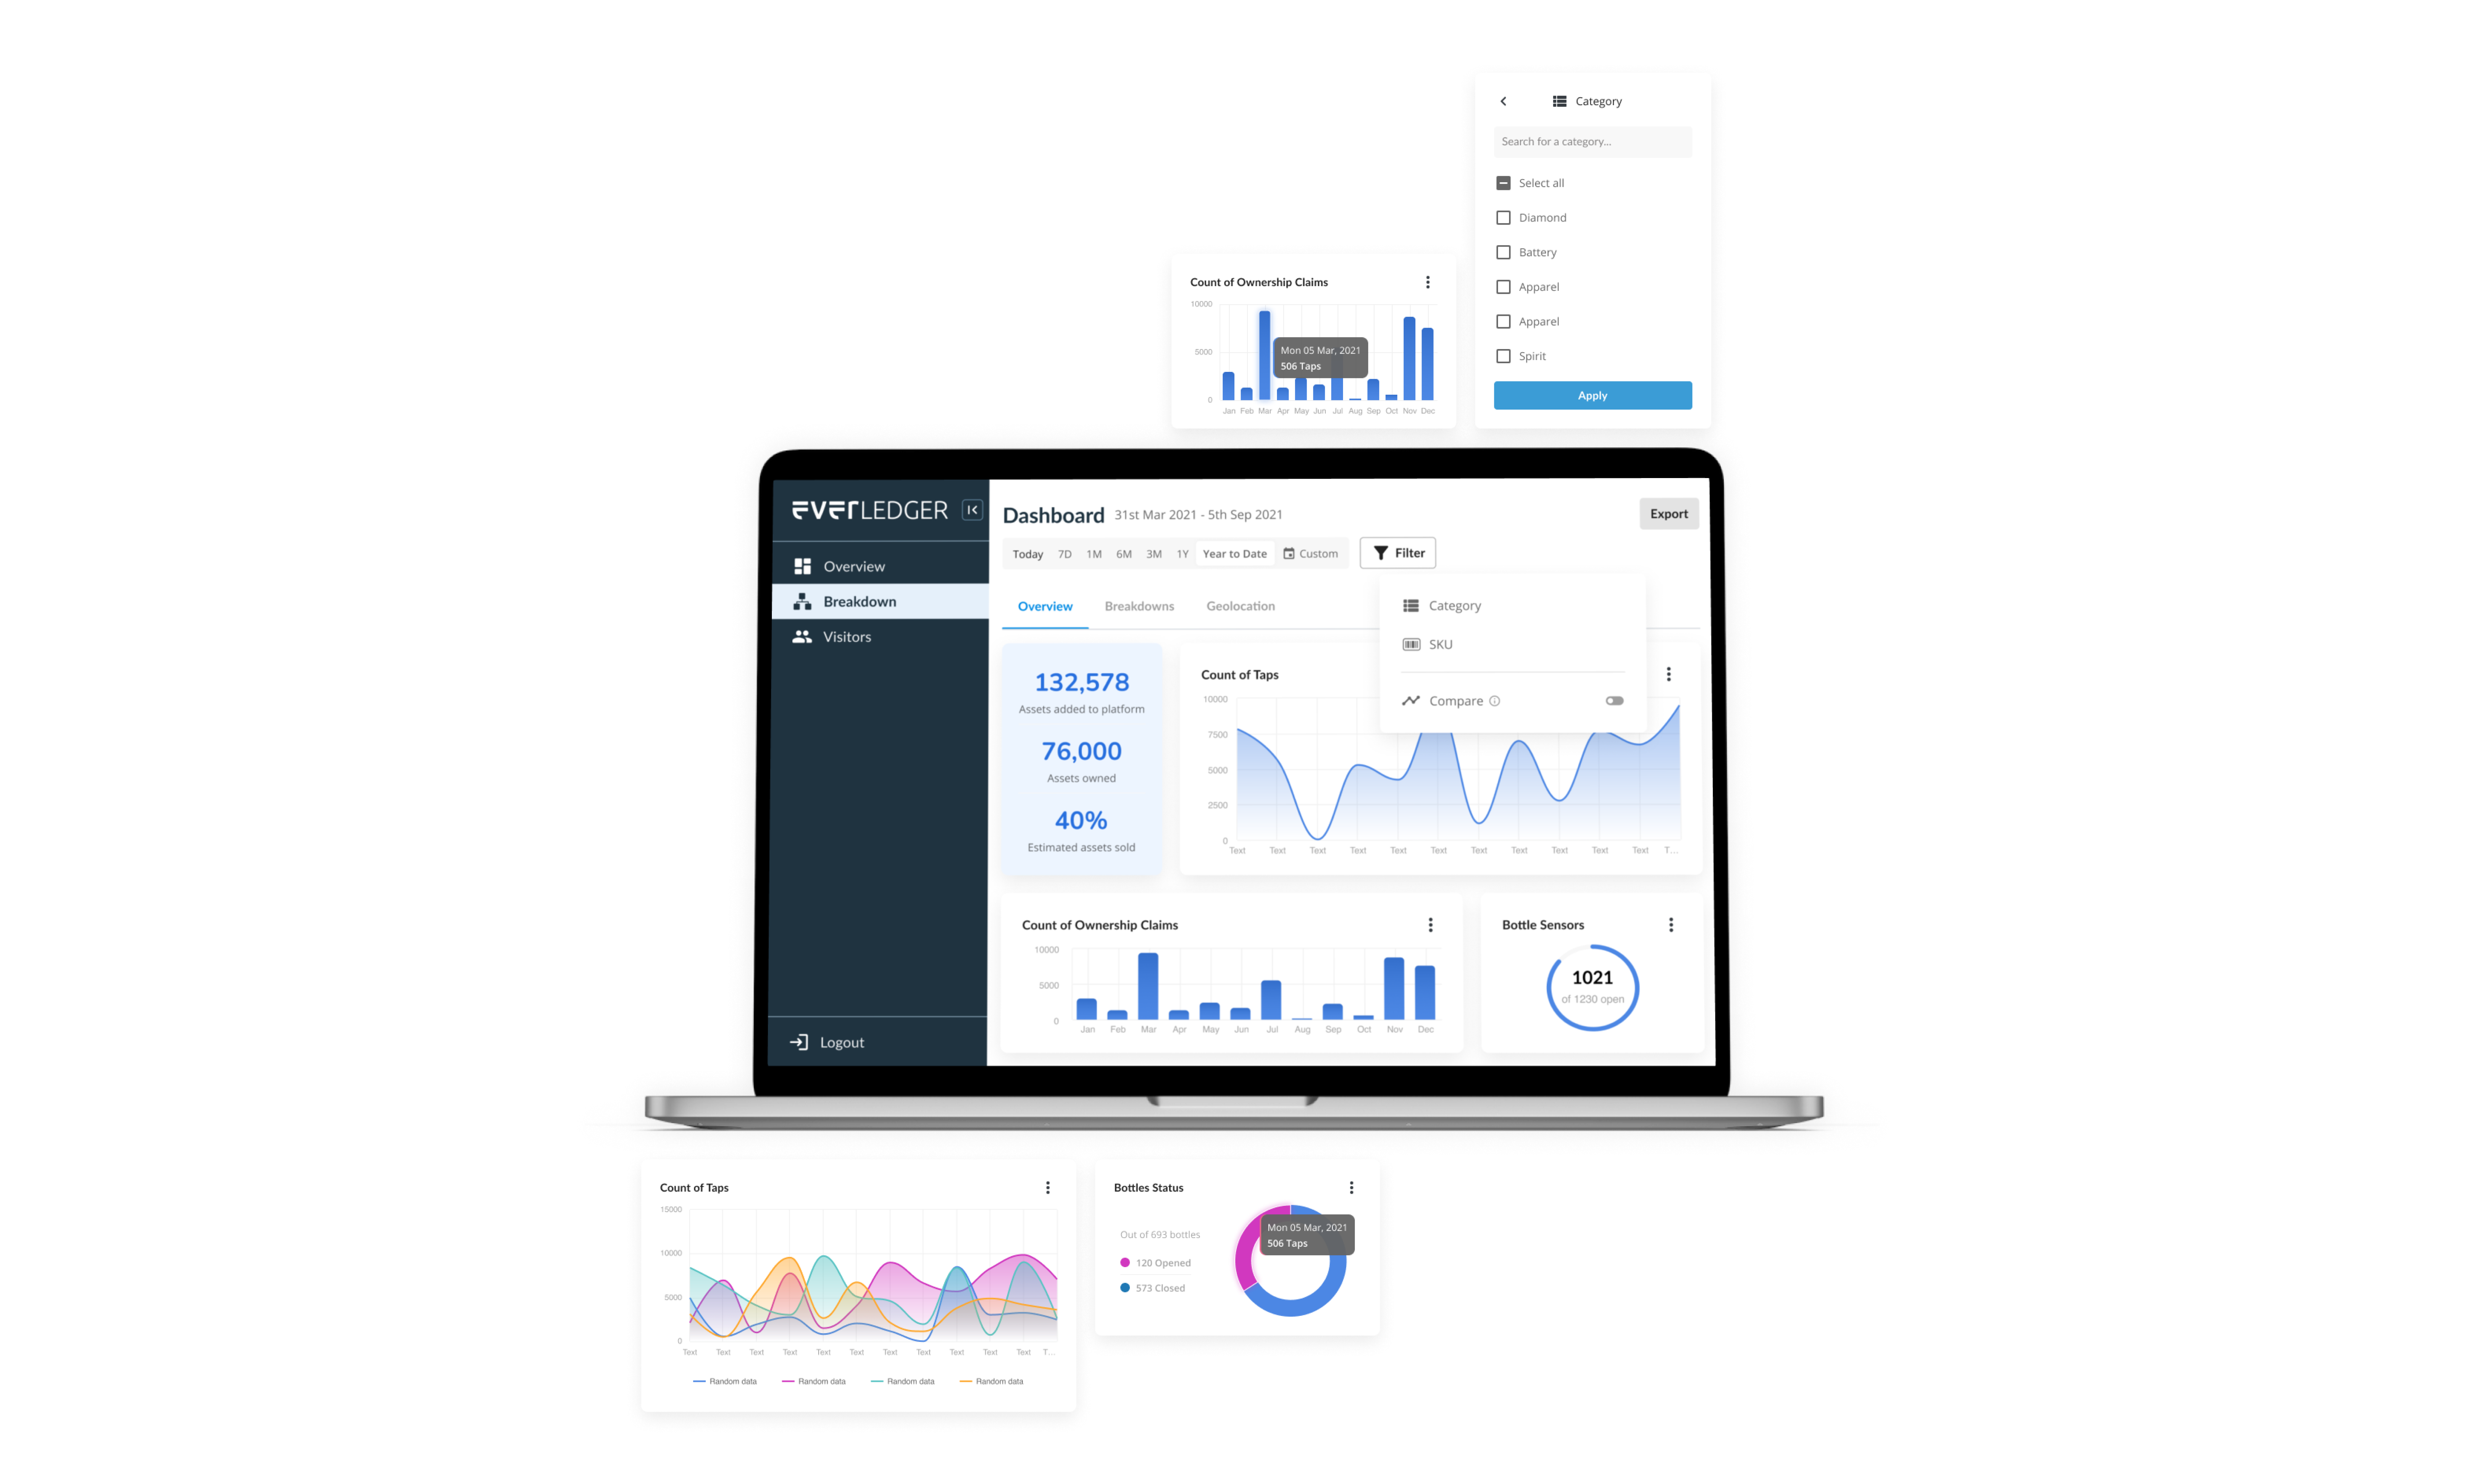
A brand new analytics dashboard that seamlessly integrated with our existing software, allowing internal stakeholders and external users to easily access and visualize the data they needed.
Our team recognized that the existing software we had built was collecting a wealth of critical data, but we lacked a centralized way to analyze and interpret it. To address this challenge, we developed a brand new analytics dashboard that seamlessly integrated with our existing software and allowed internal stakeholders and external users to easily access and visualize the data.
By applying best practices in UX/UI design, we ensured that the dashboard provided a user-friendly and comprehensive solution that delivered key insights and enabled data-driven decision-making.
Problem
Our internal stakeholders were struggling to track clients and transactions through spreadsheets, which were time-consuming and prone to errors. At the same time, our users were facing challenges in gaining insights from the vast amounts of data generated by our platform, particularly in terms of where their products ended up and managing their inventory. We realized that we needed a more efficient and user-friendly solution that could bring all this data together and provide actionable insights.
We needed a solution that could handle large amounts of data, provide real-time insights, offer customizable visualizations, and allow for easy sharing with different types of users and also fit within our main traceability platform. Additionally, scalability was a critical factor, as our needs were constantly evolving and growing over time.
Putting users first
At the beginning of this project, we prioritized understanding our users’ needs to create an analytics dashboard that would be genuinely beneficial and user-friendly. To achieve this, we employed various research methods.
We initiated the research phase by conducting interviews with both internal stakeholders and a representative sample of users to identify their needs and pain points. We also held collaborative workshops with the users on Miro to develop user journeys and empathy maps, which helped us comprehend their objectives and motivations.
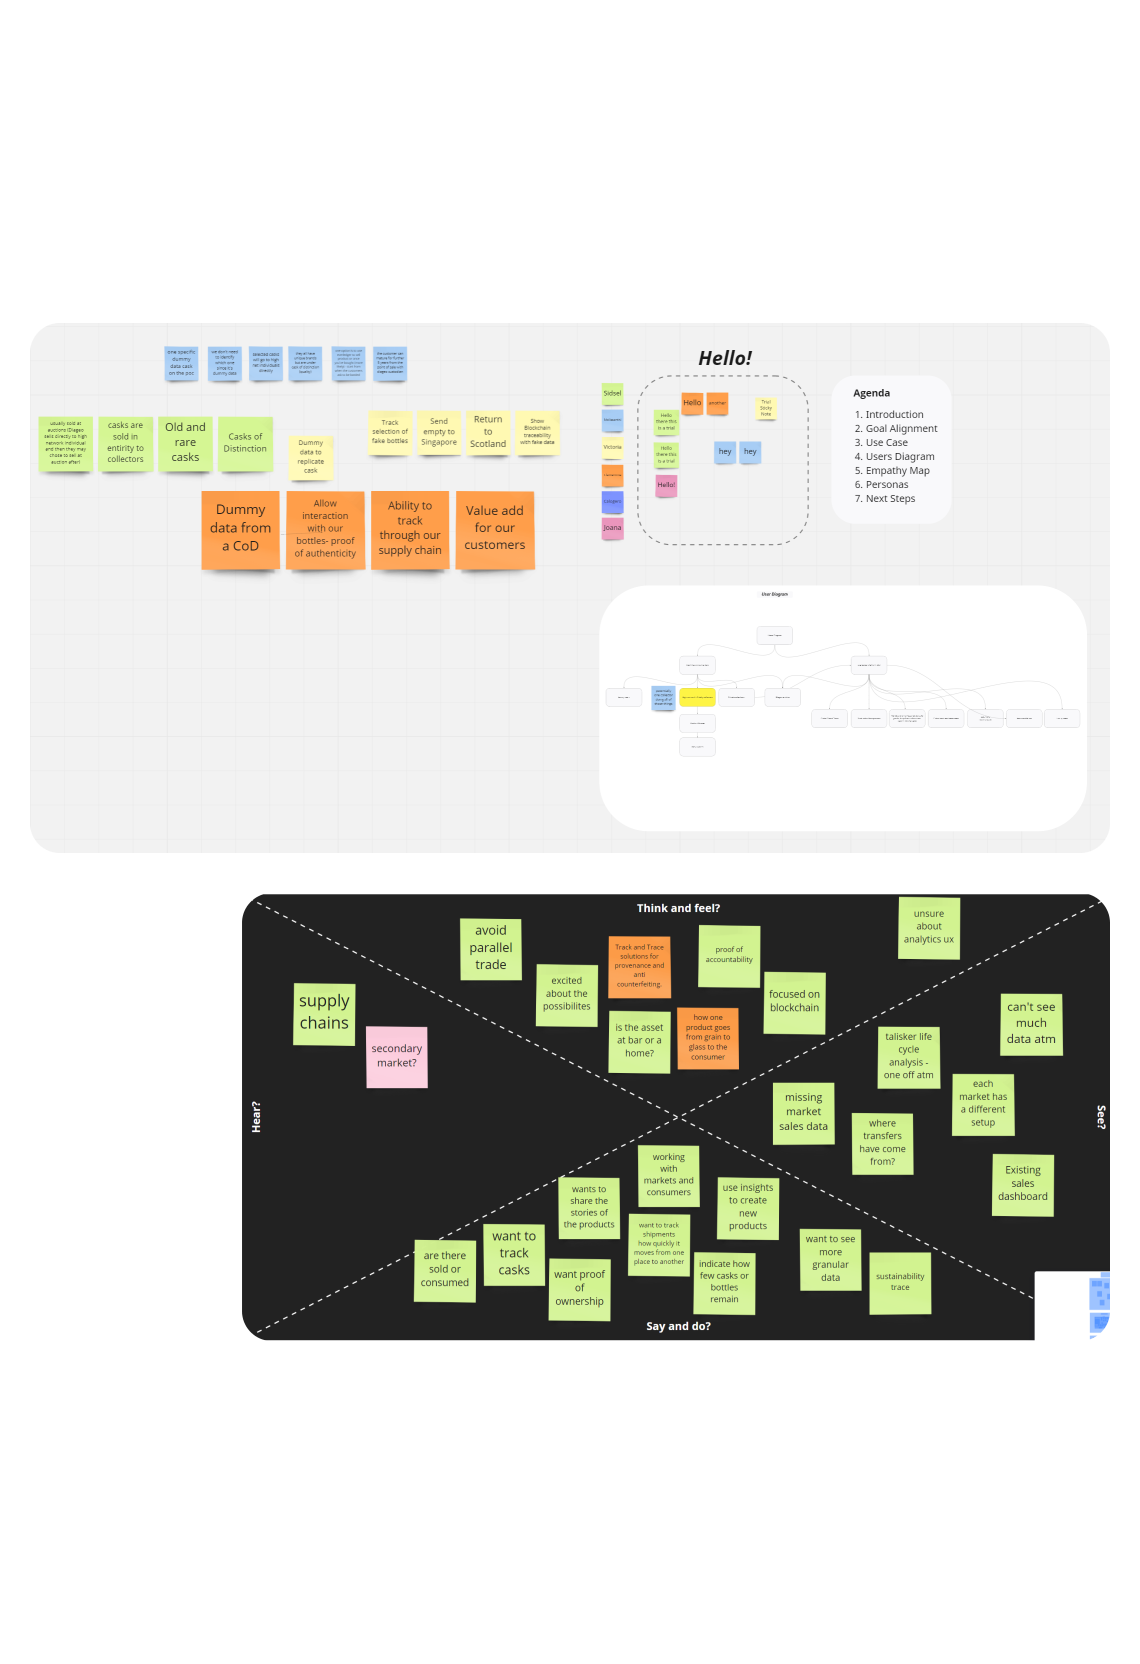
Empathising with users
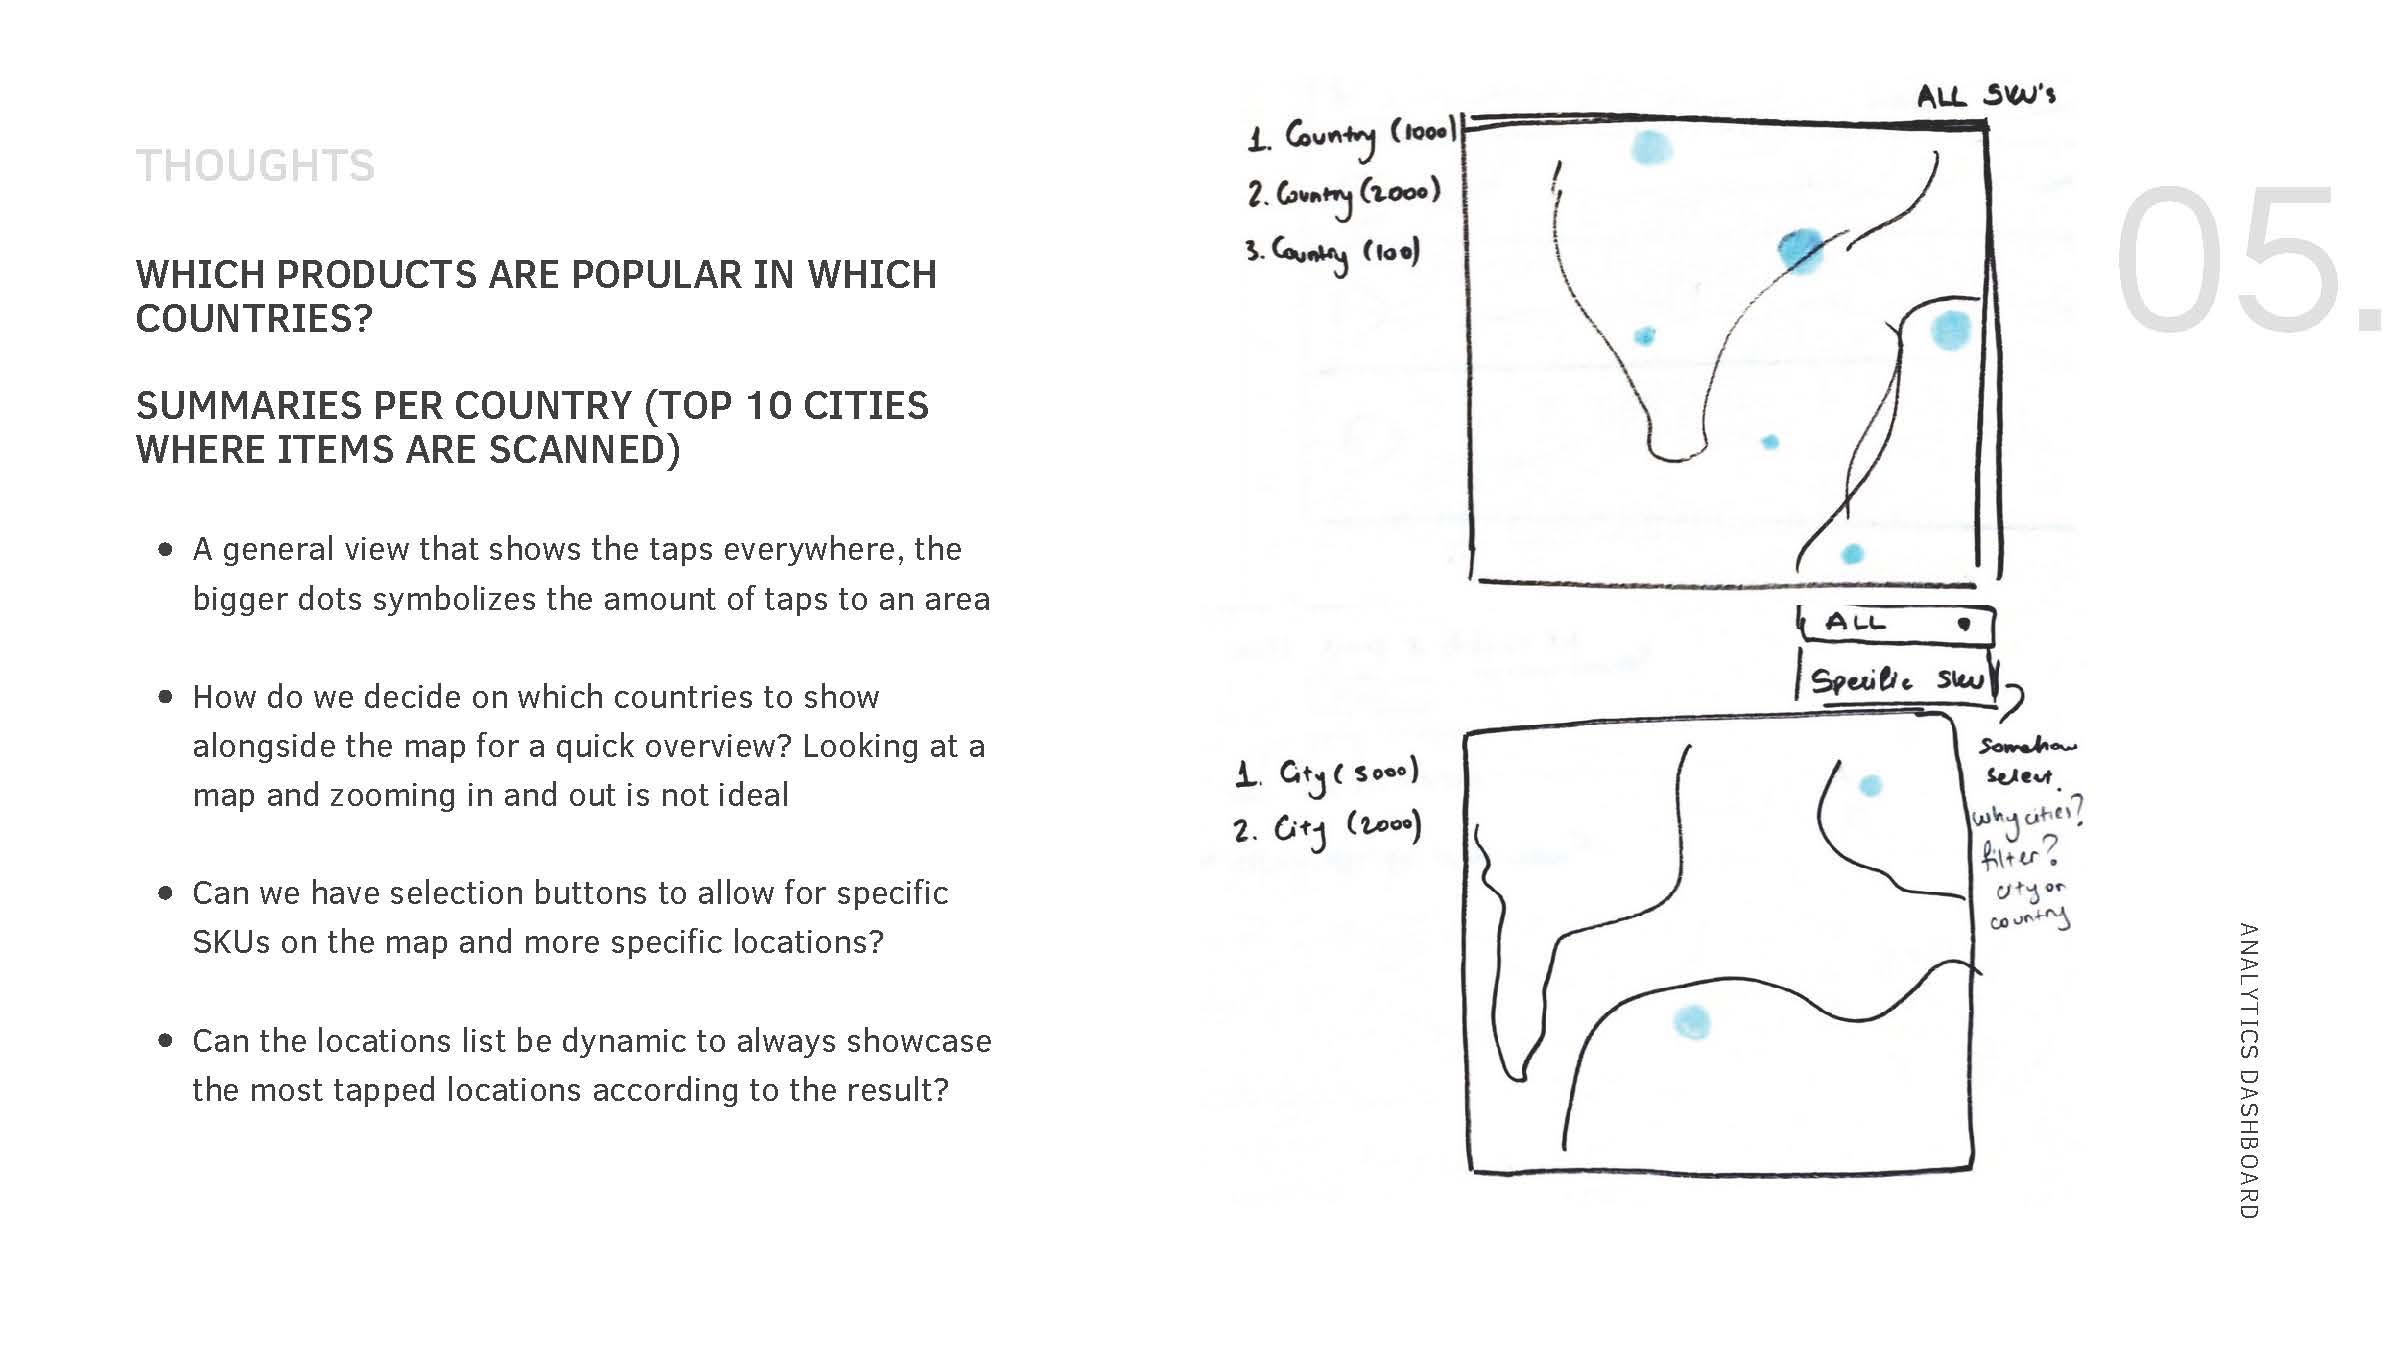
One of the key findings from our research was that our users wanted to see where their products were being used and which regions were performing best, in order to better target their marketing efforts.
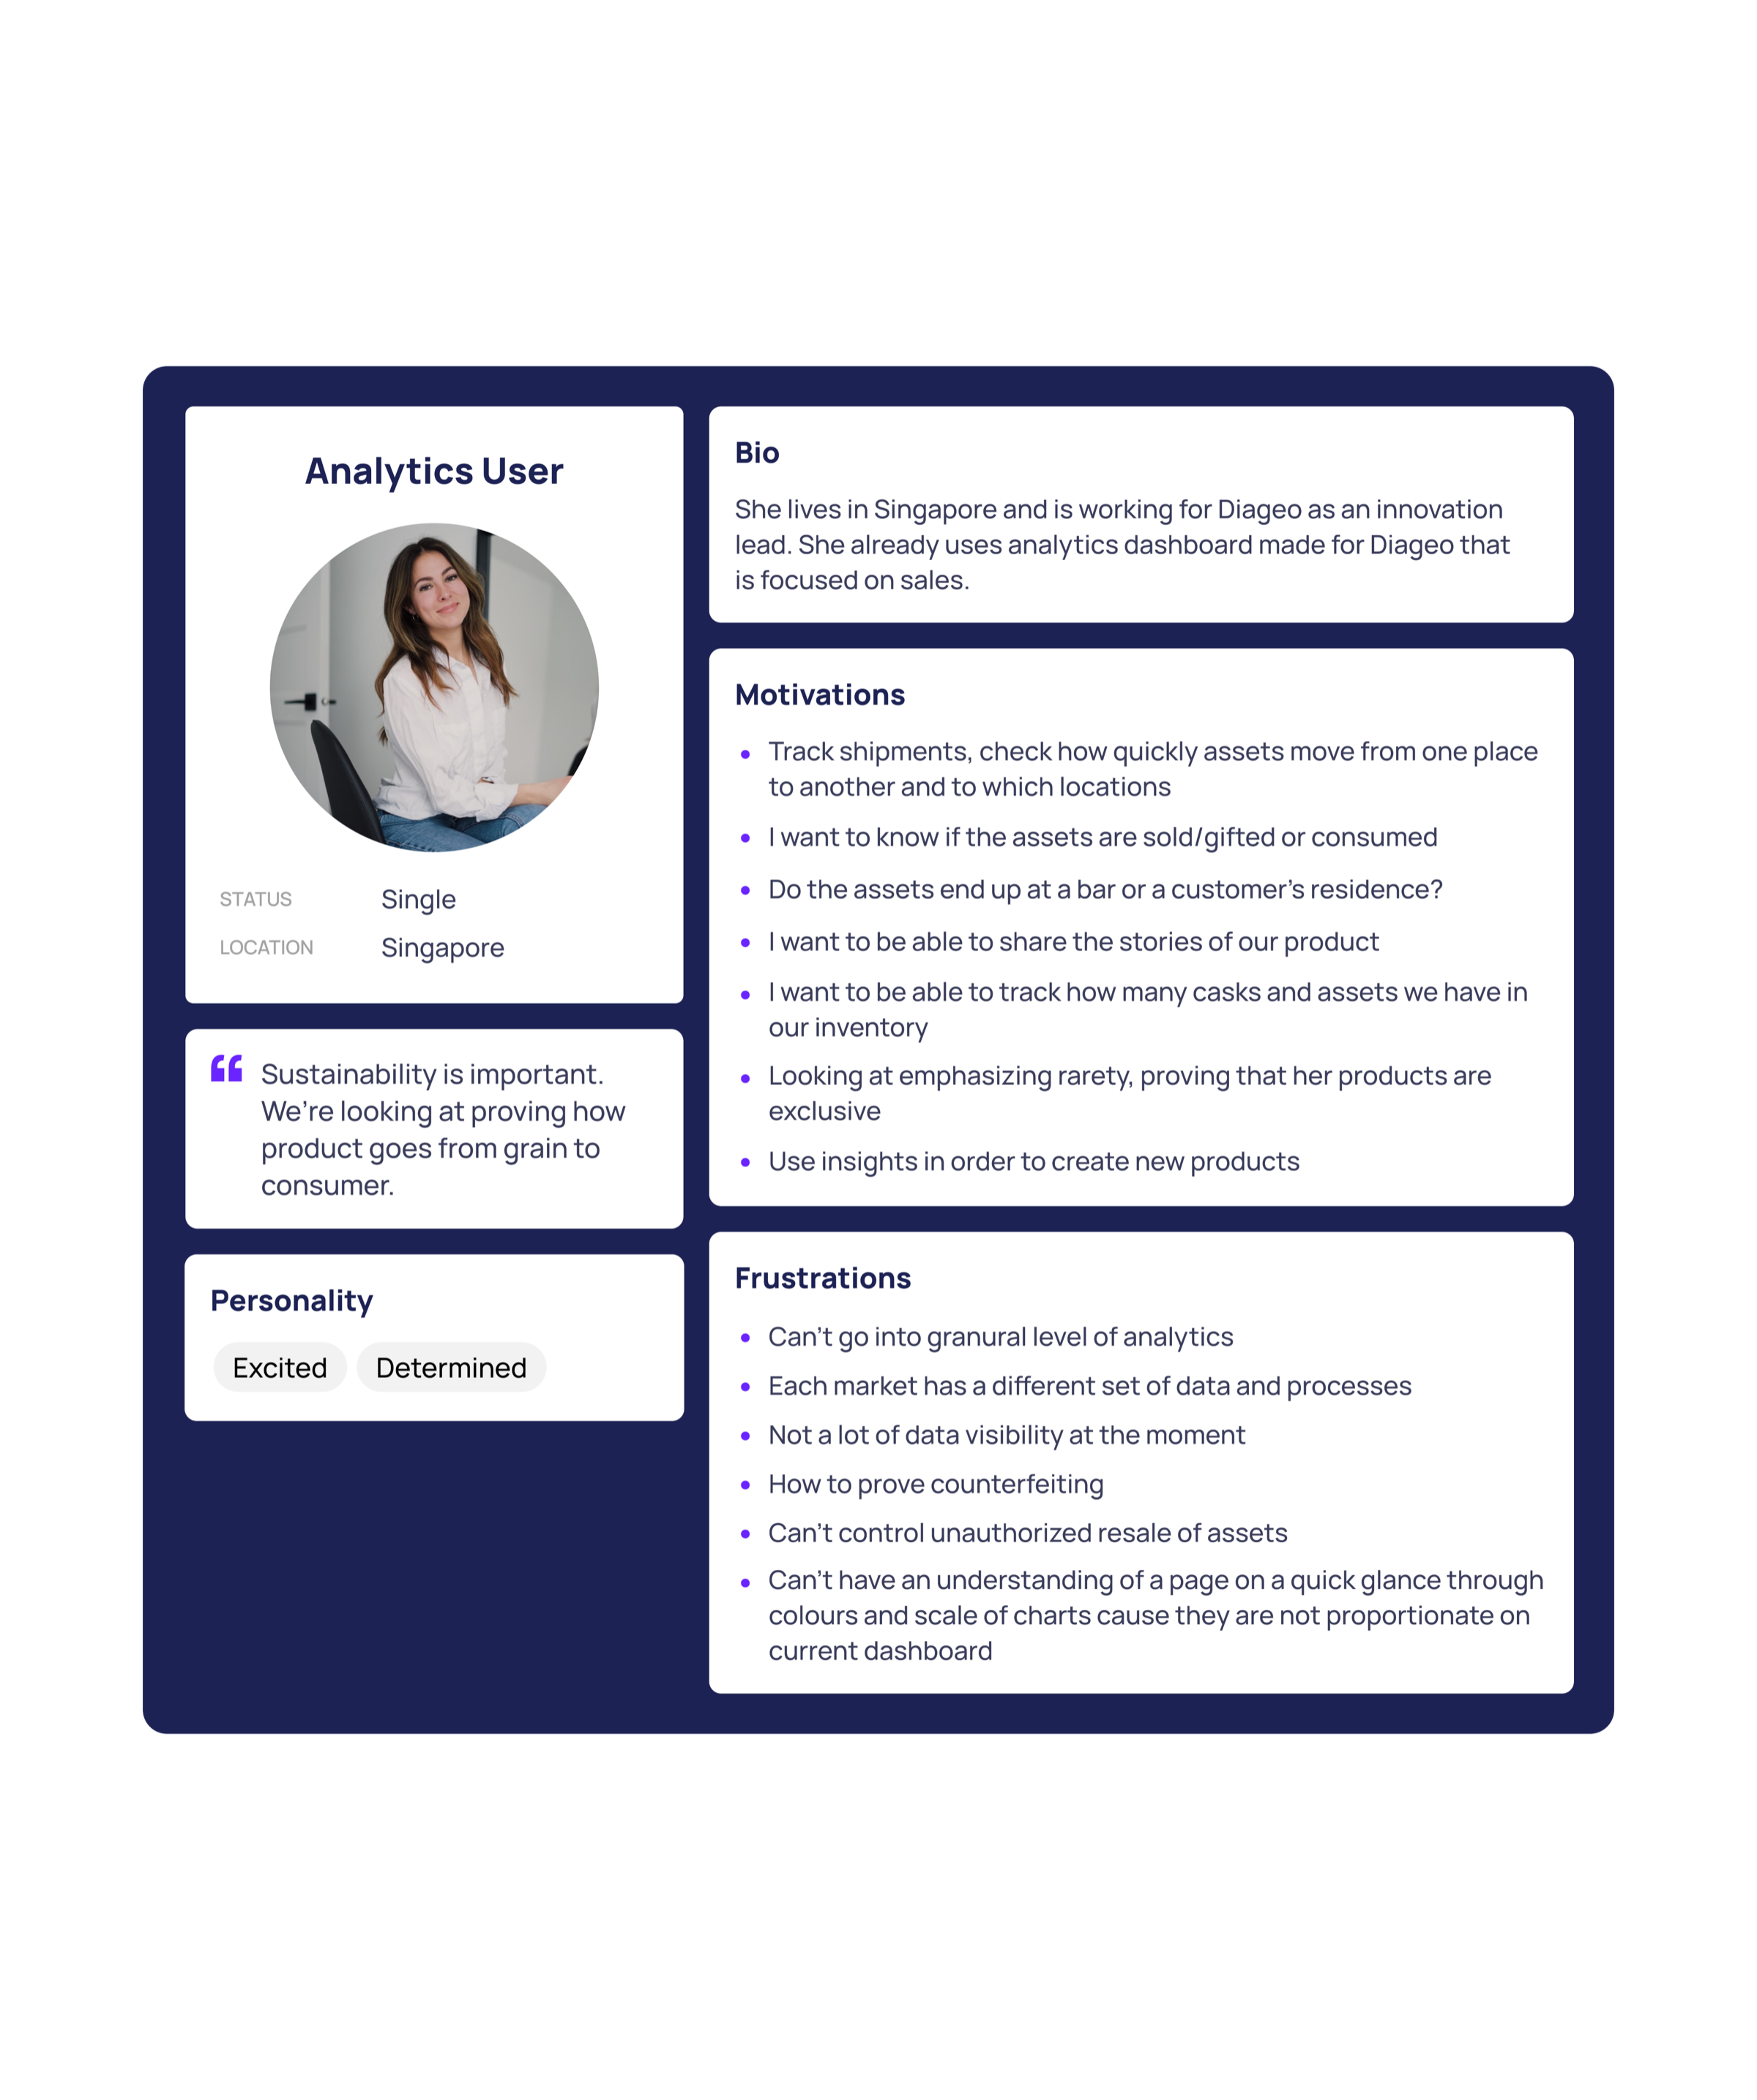
Using this feedback, we created a persona for some of our external users and worked with internal stakeholders and product teams to define the rest of them. These personas were then shared with the wider team to ensure that everyone had a clear understanding of who we were designing the dashboard for and what their needs were.
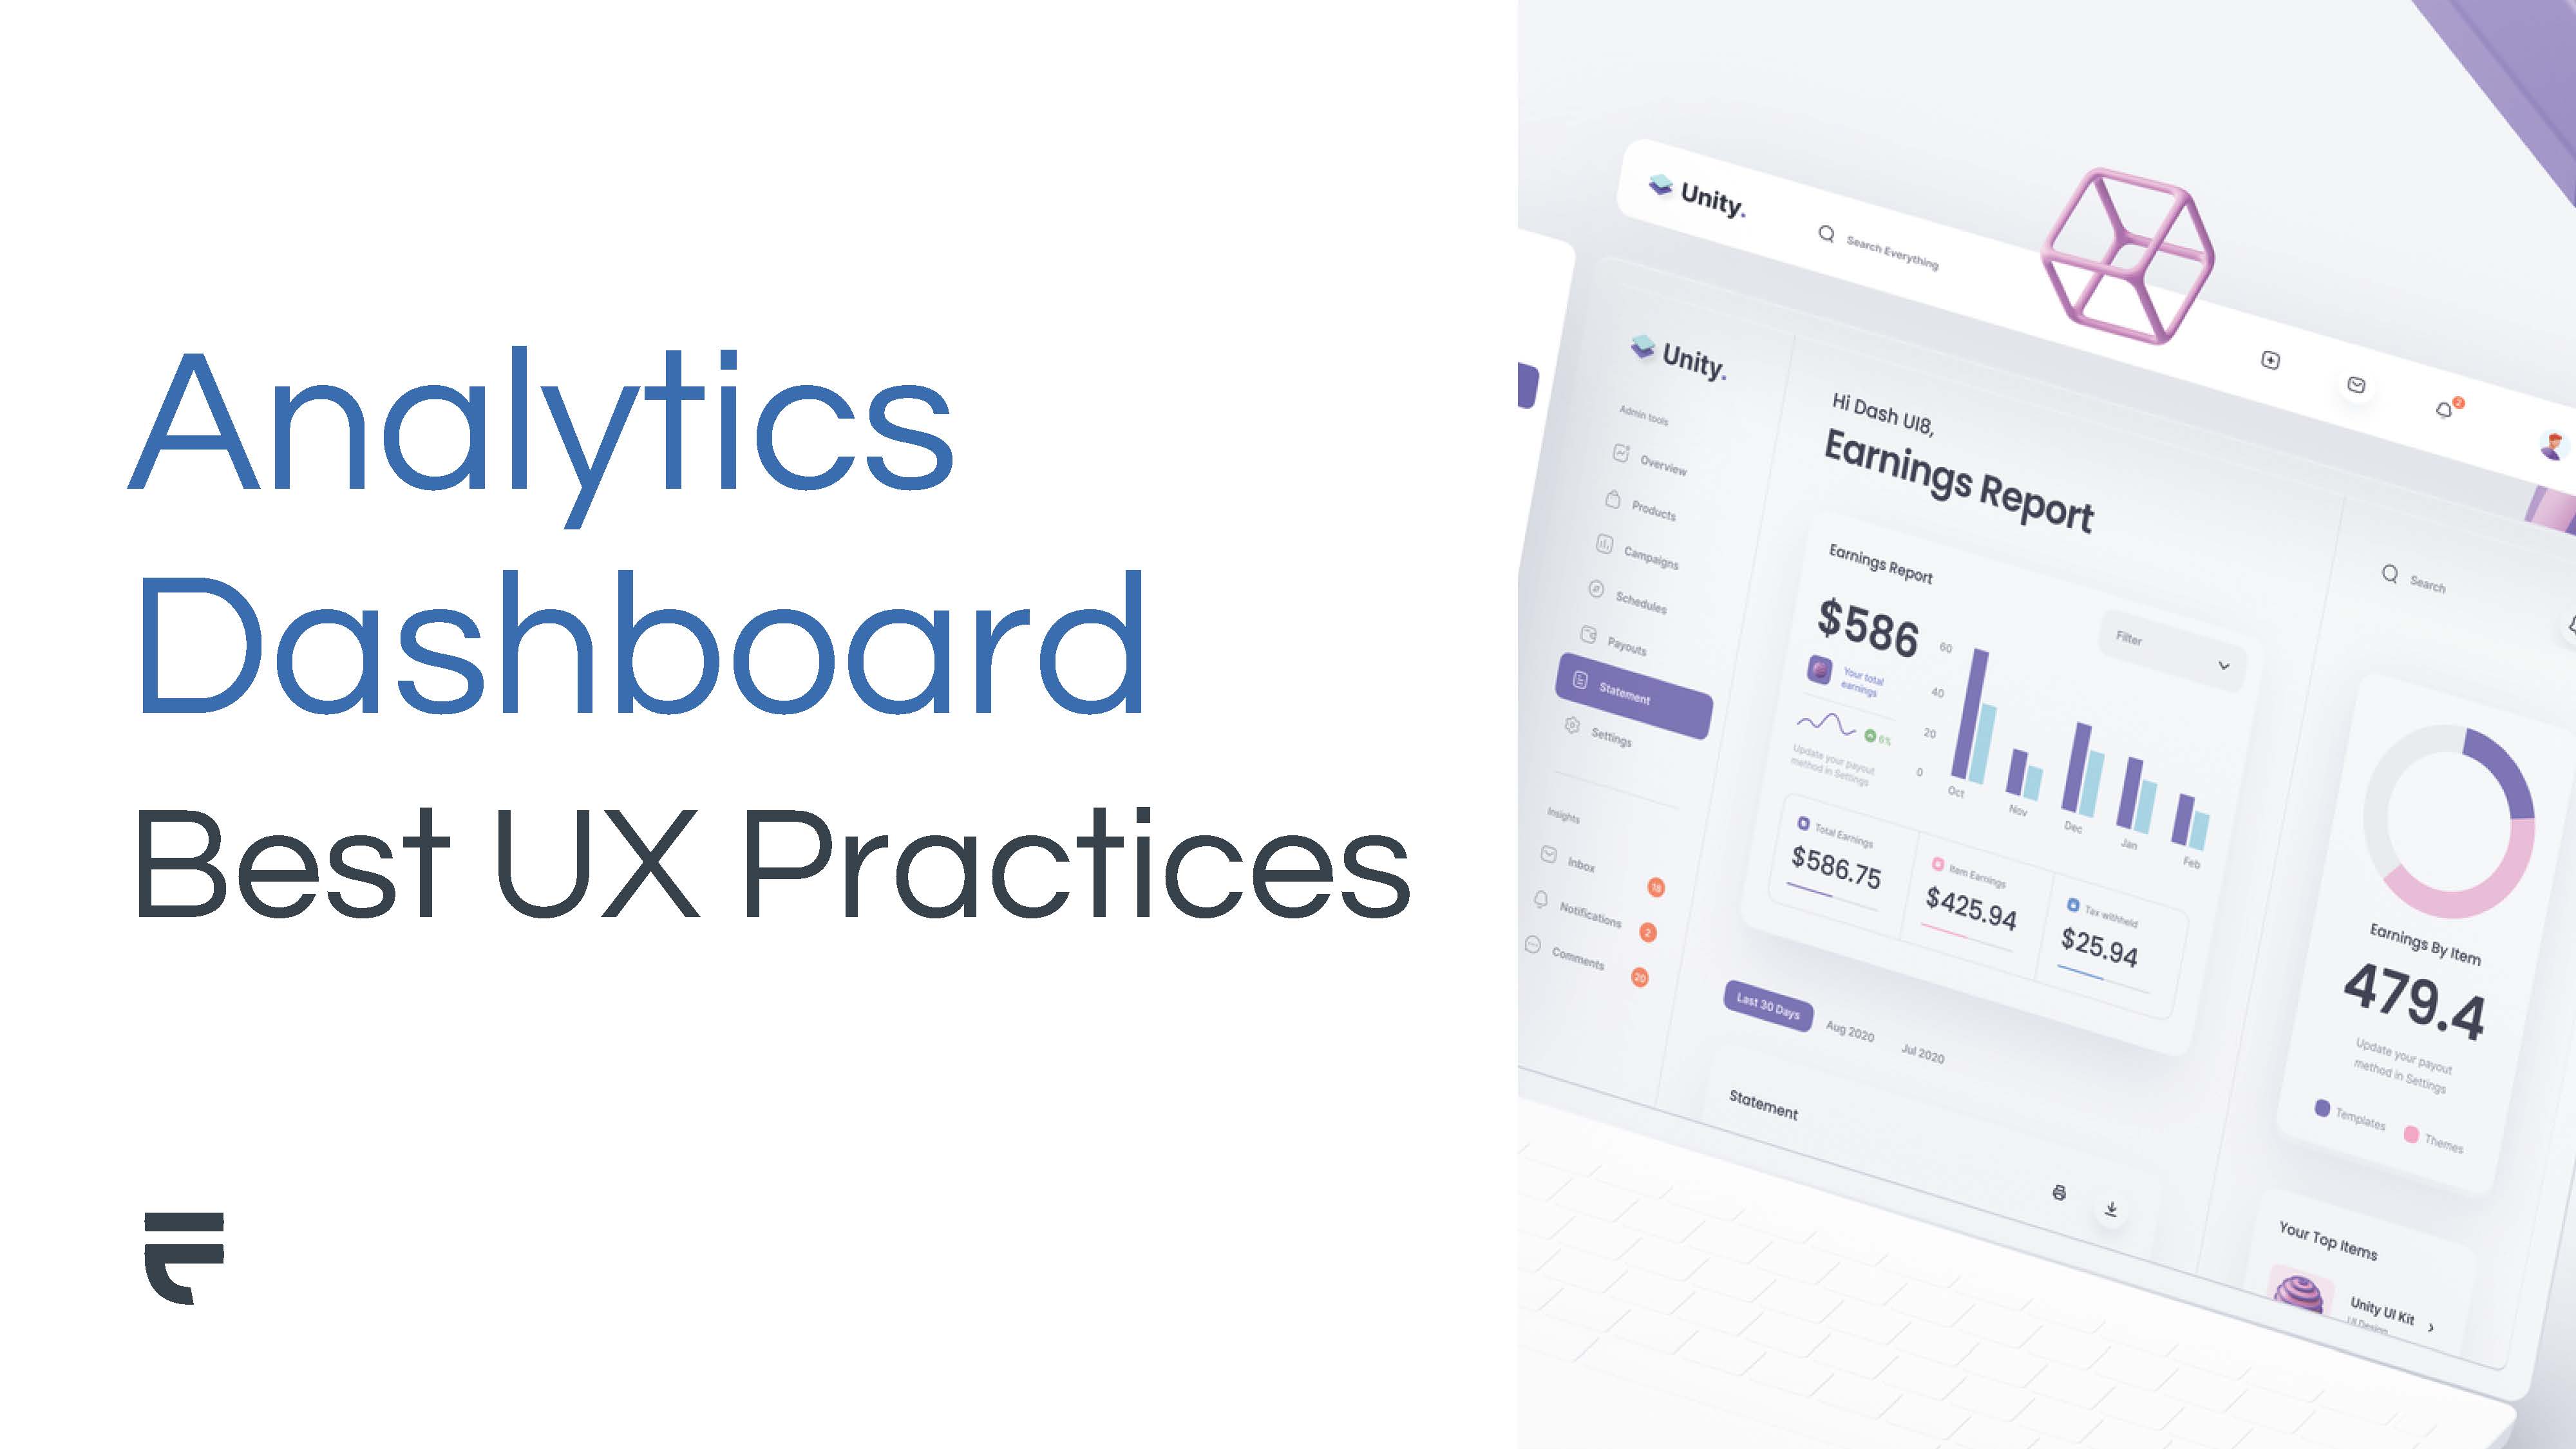
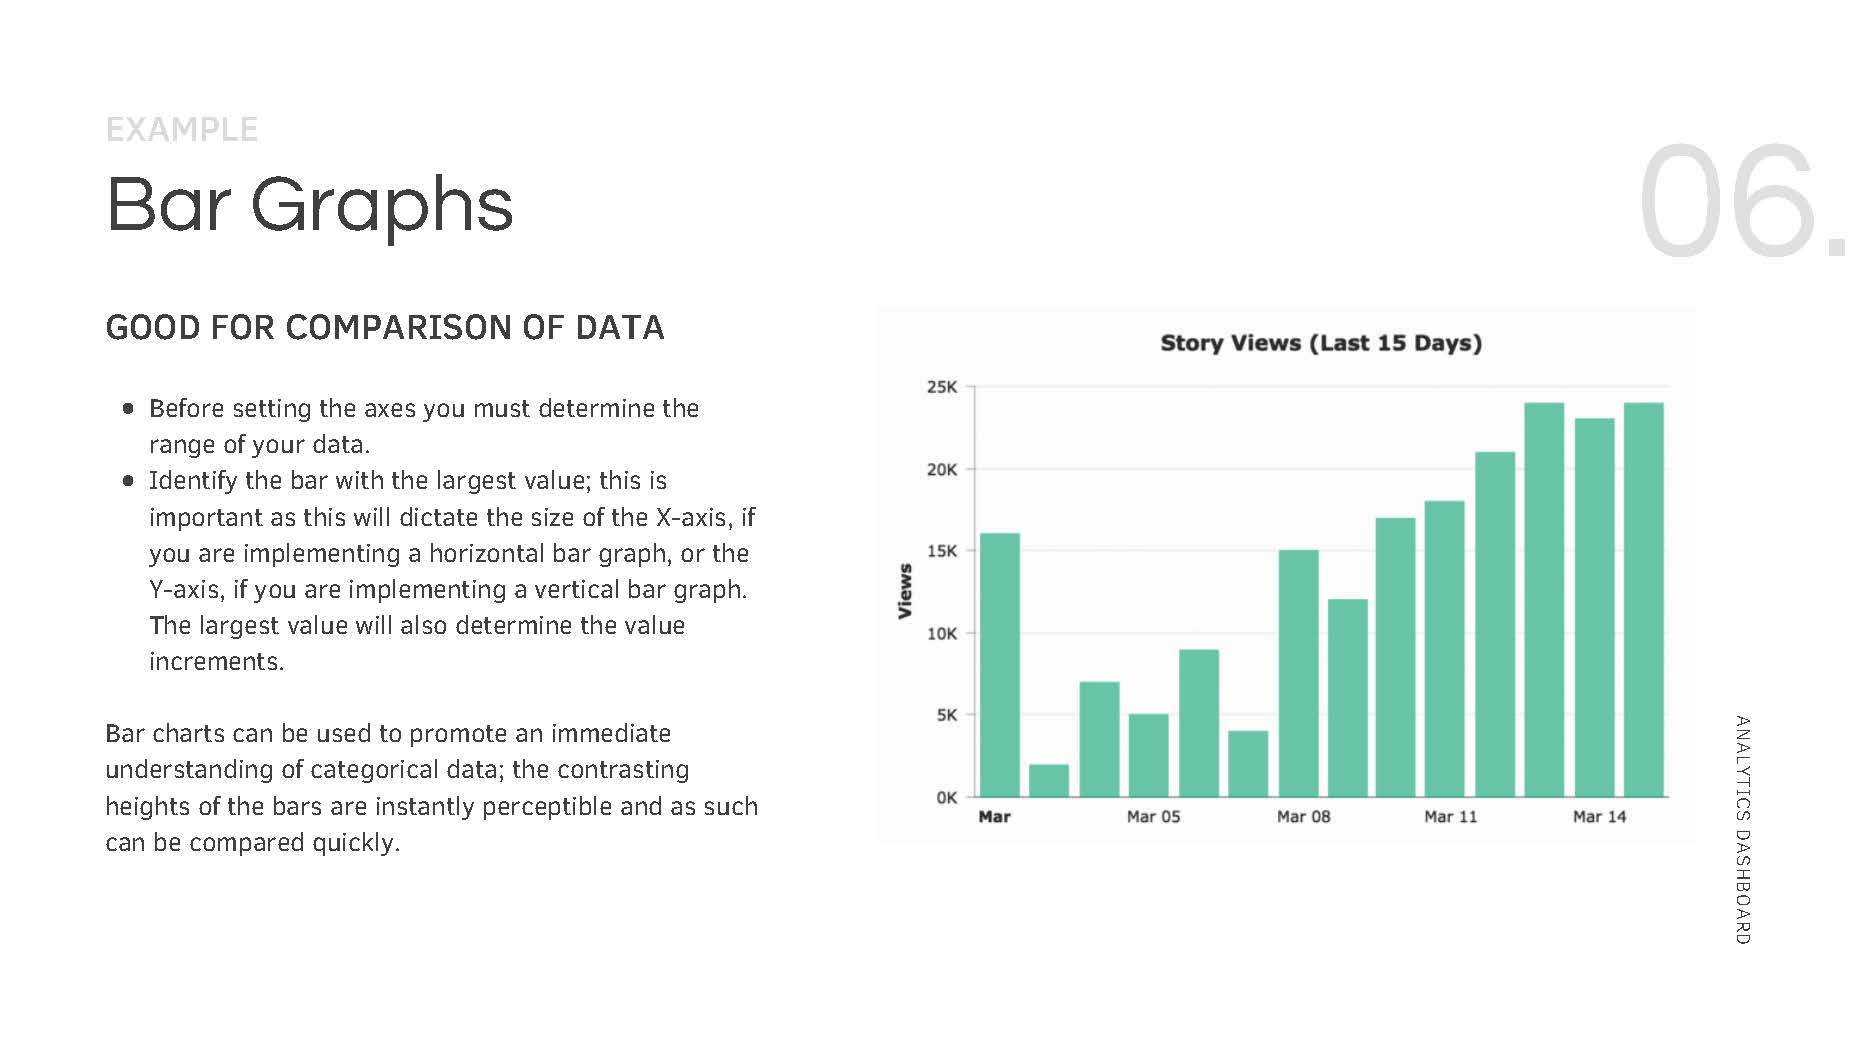
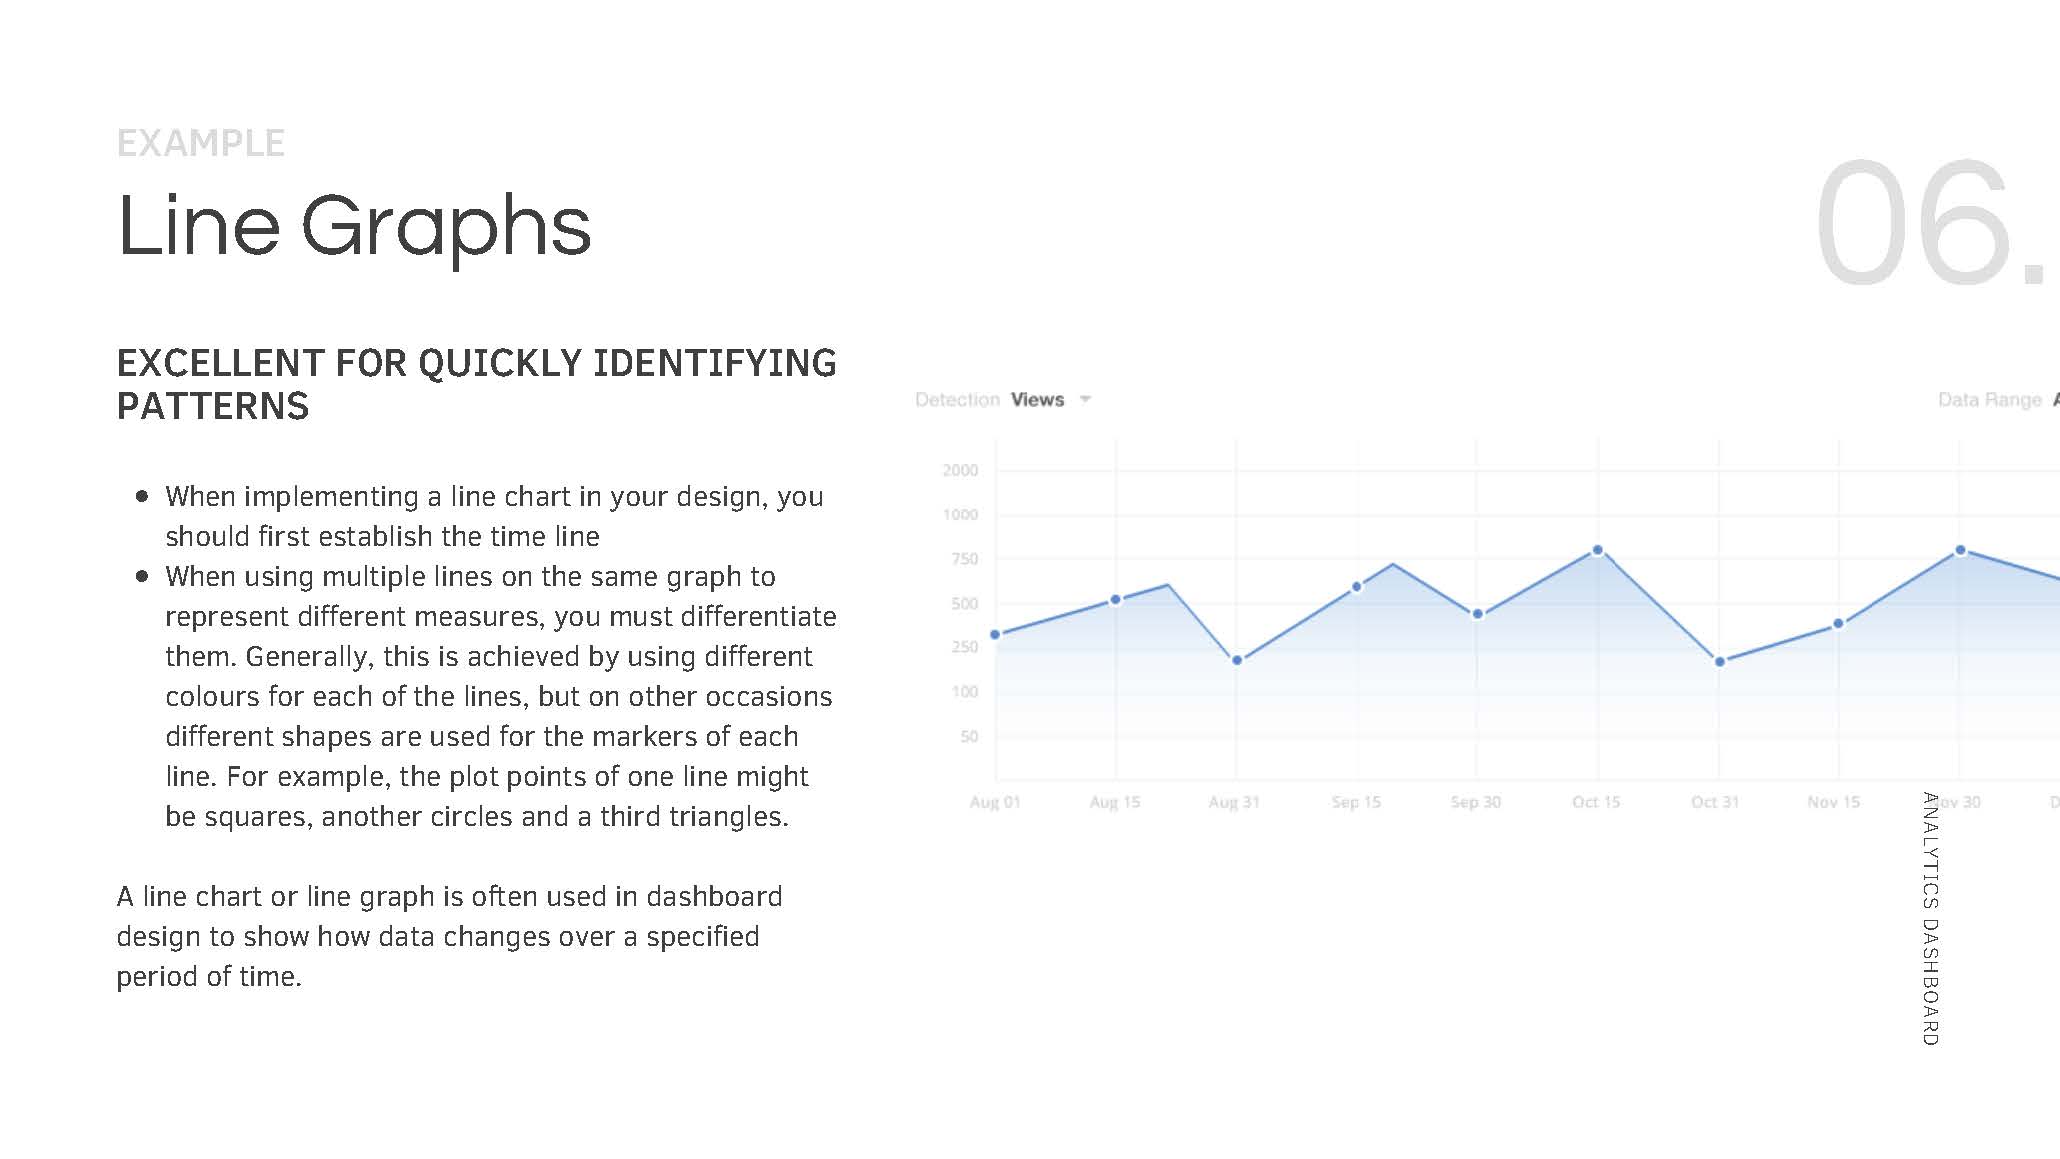
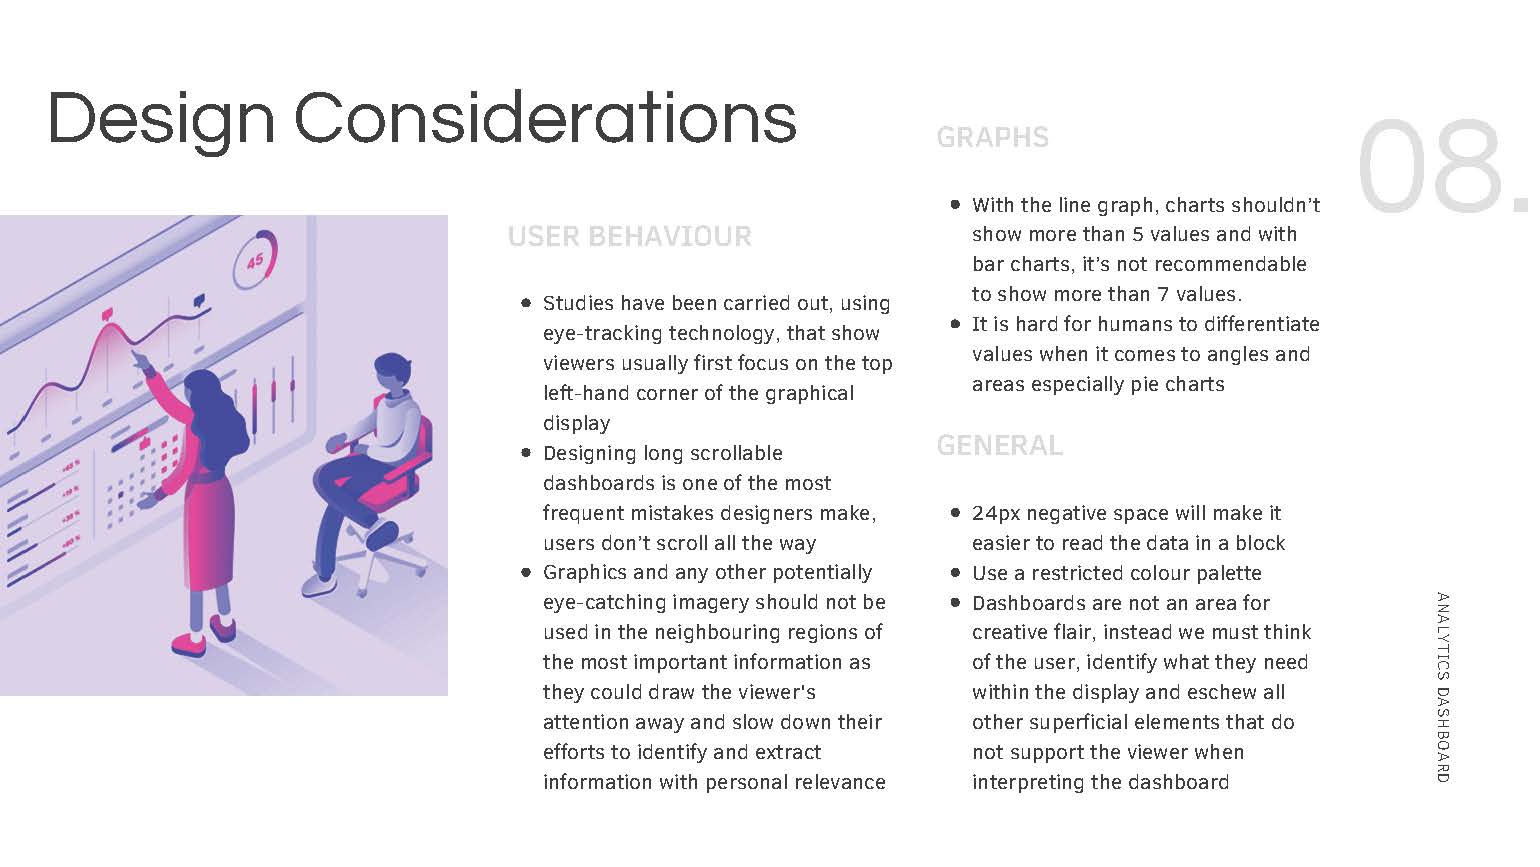
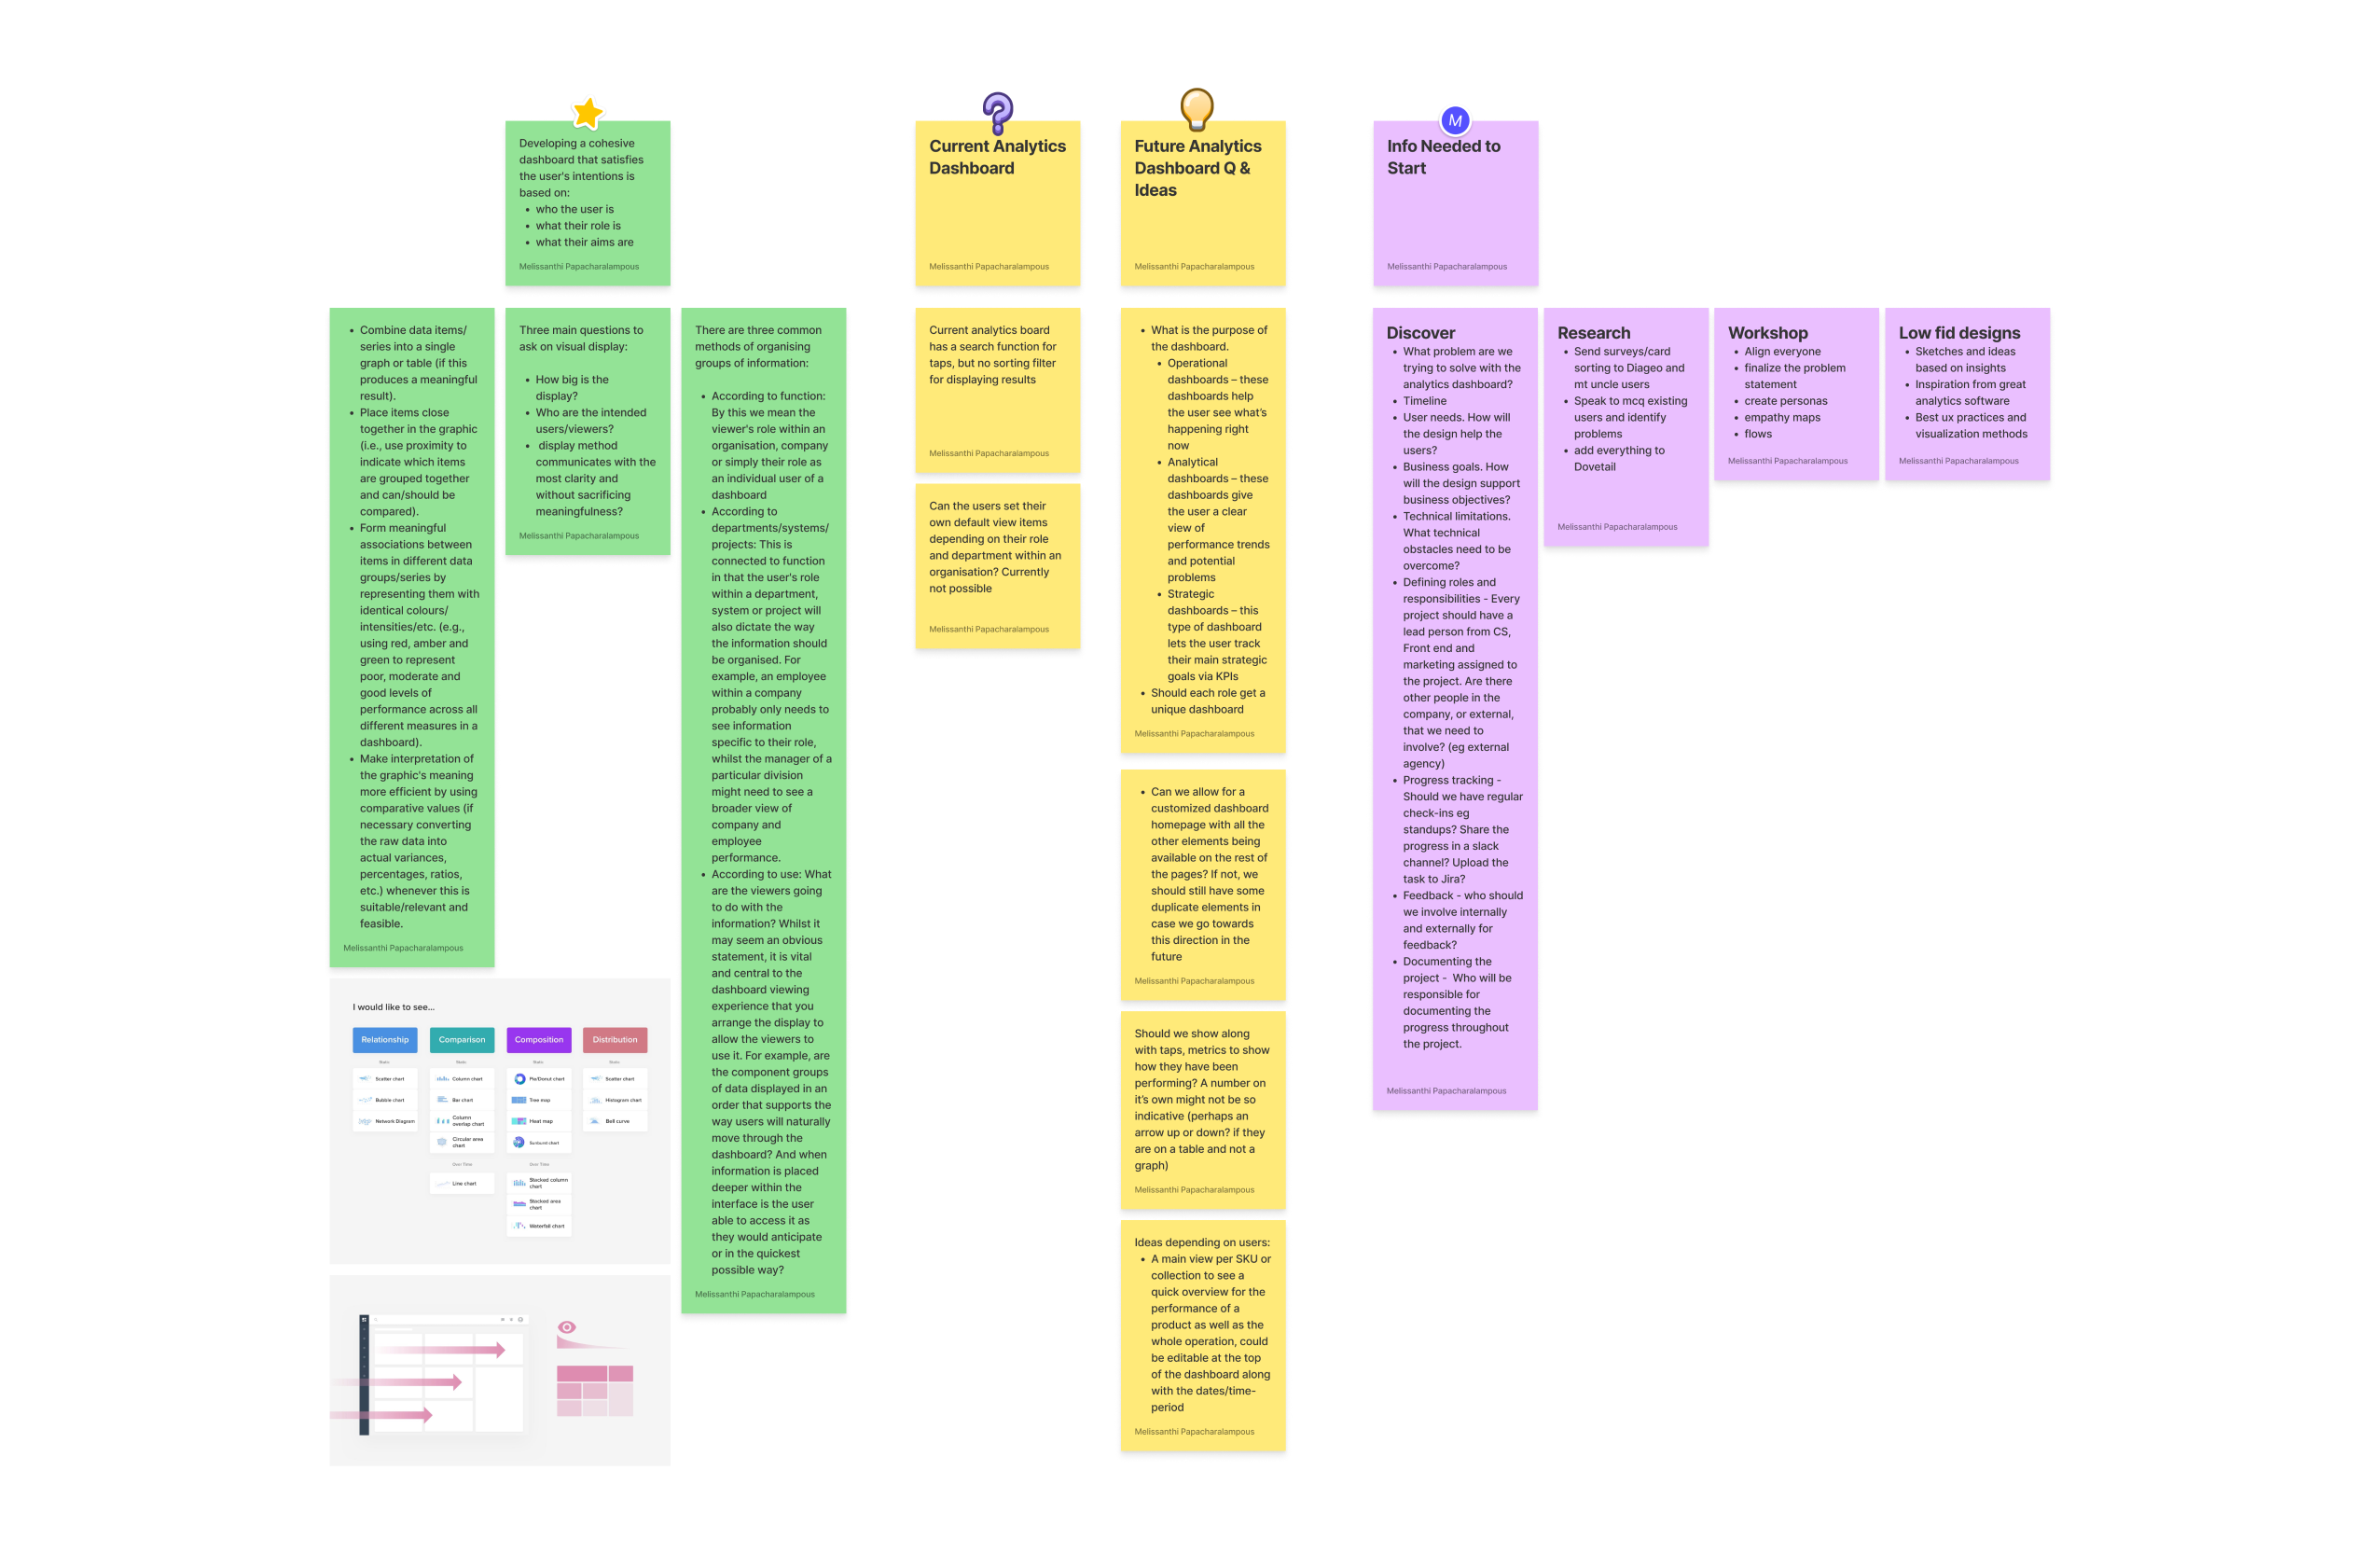
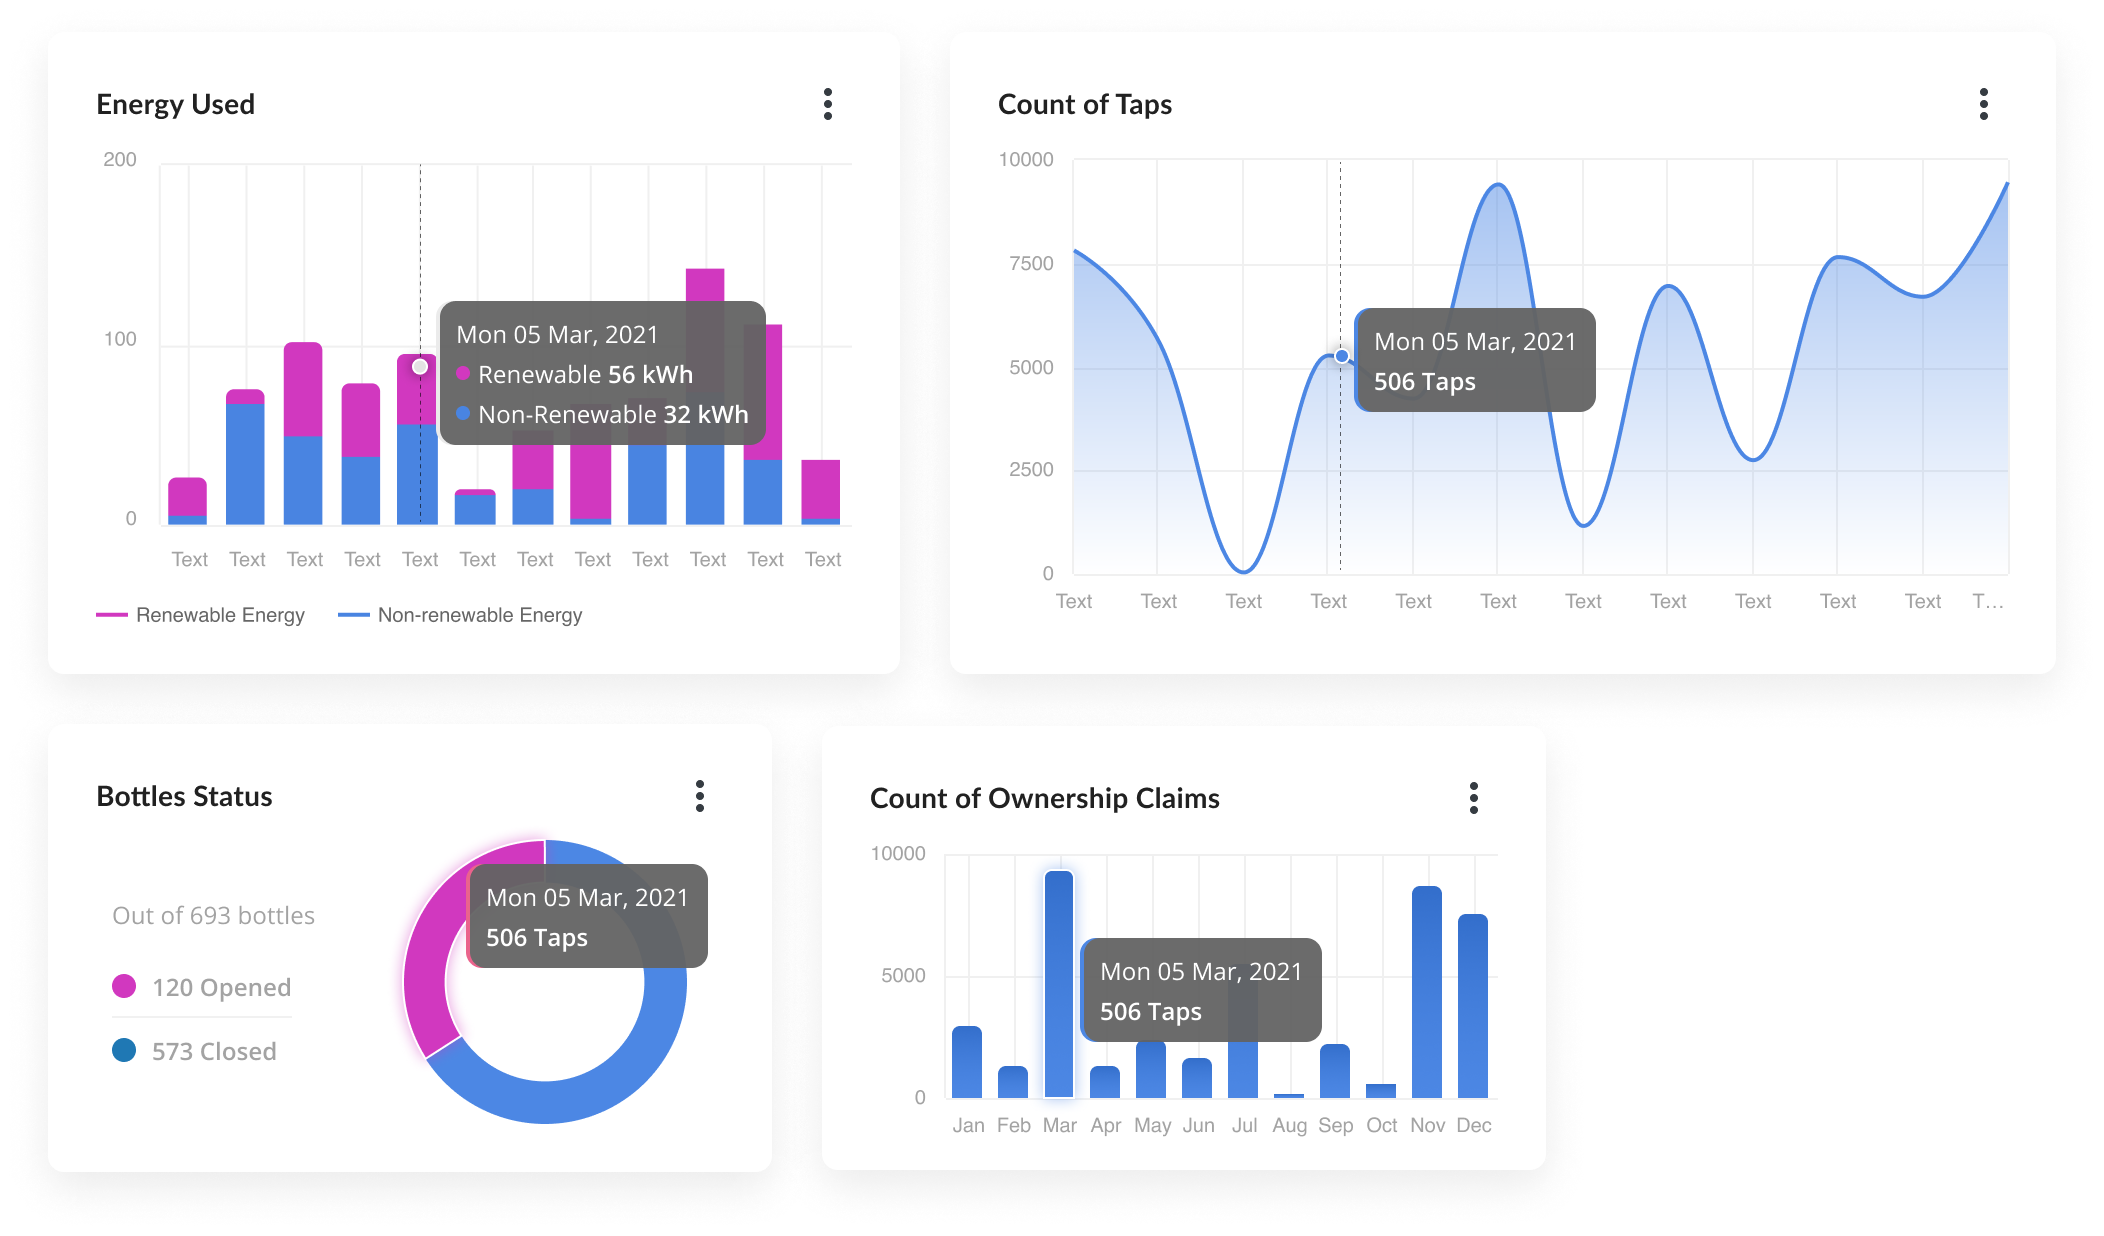
Data visualisation best practices
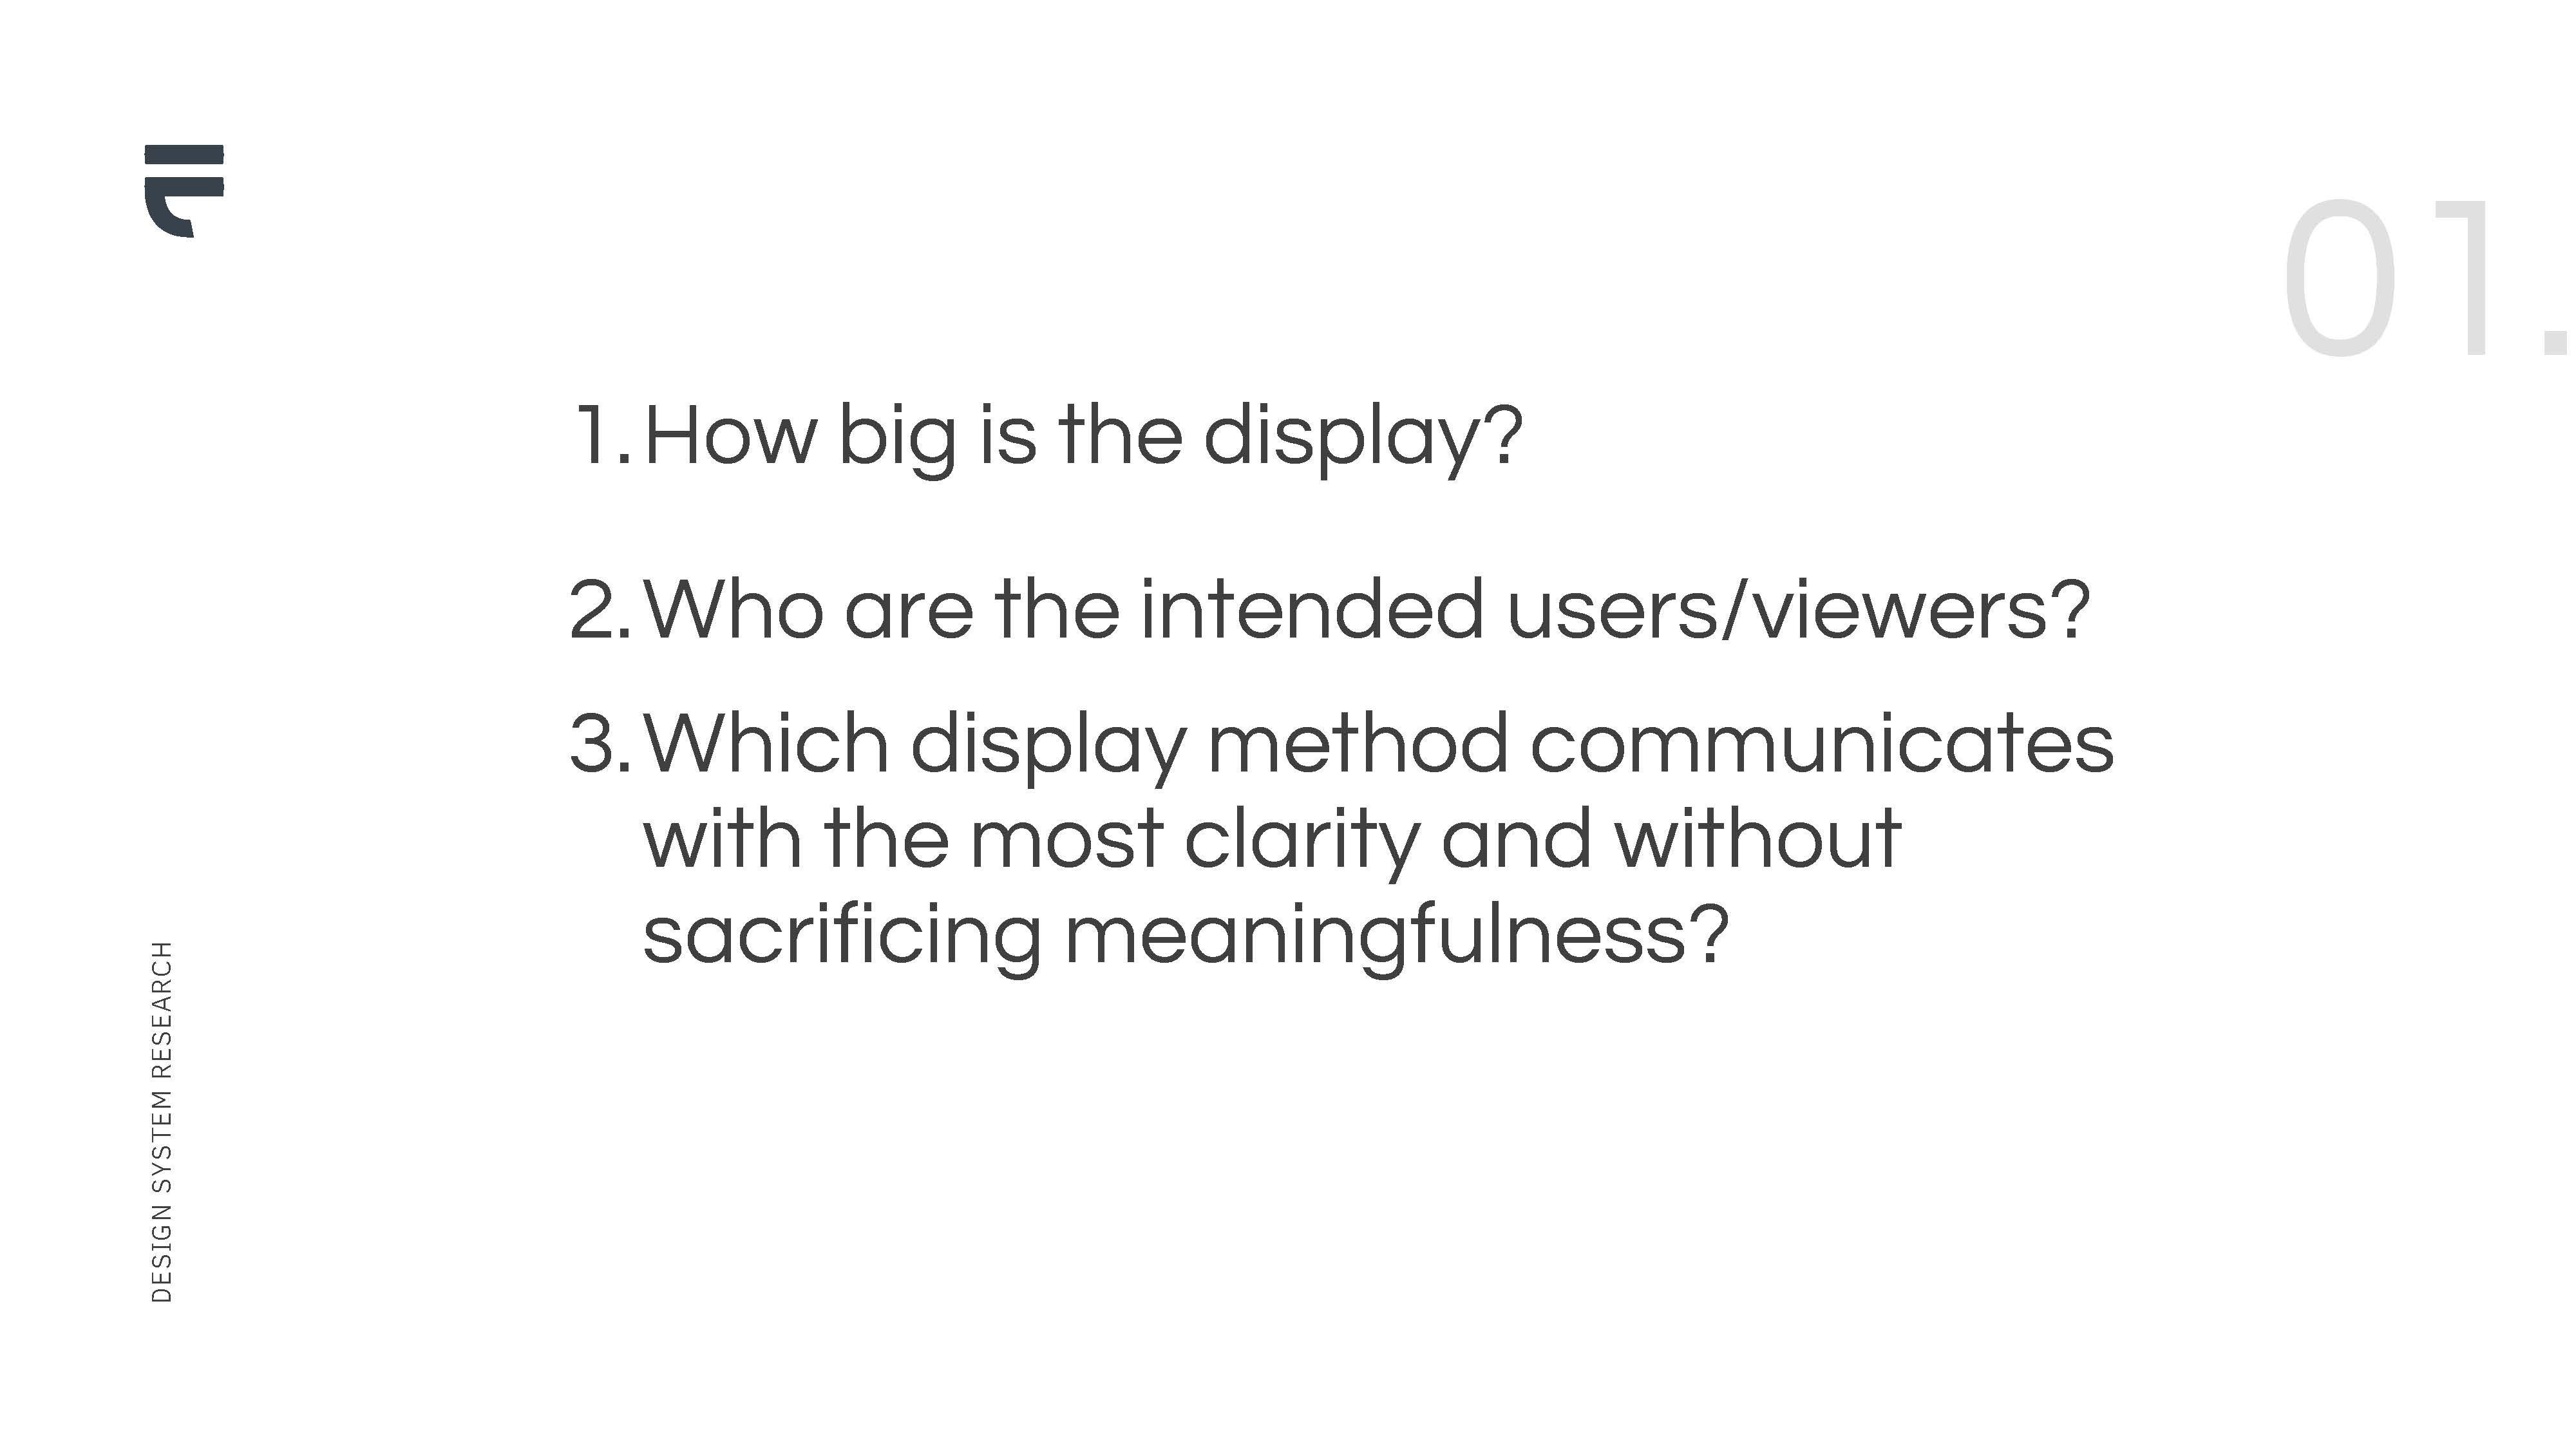
As a designer, I understood that an analytics dashboard needed to be visually appealing, user-friendly, and informative. To enhance my UX research skills, I took some analytics and data visualization courses and conducted research to understand the best practices in the field.
With this knowledge, I developed my own research questions within a presentation to guide the design process and collaborated closely with the product and tech teams to ensure the final dashboard met the needs of our users and internal stakeholders.


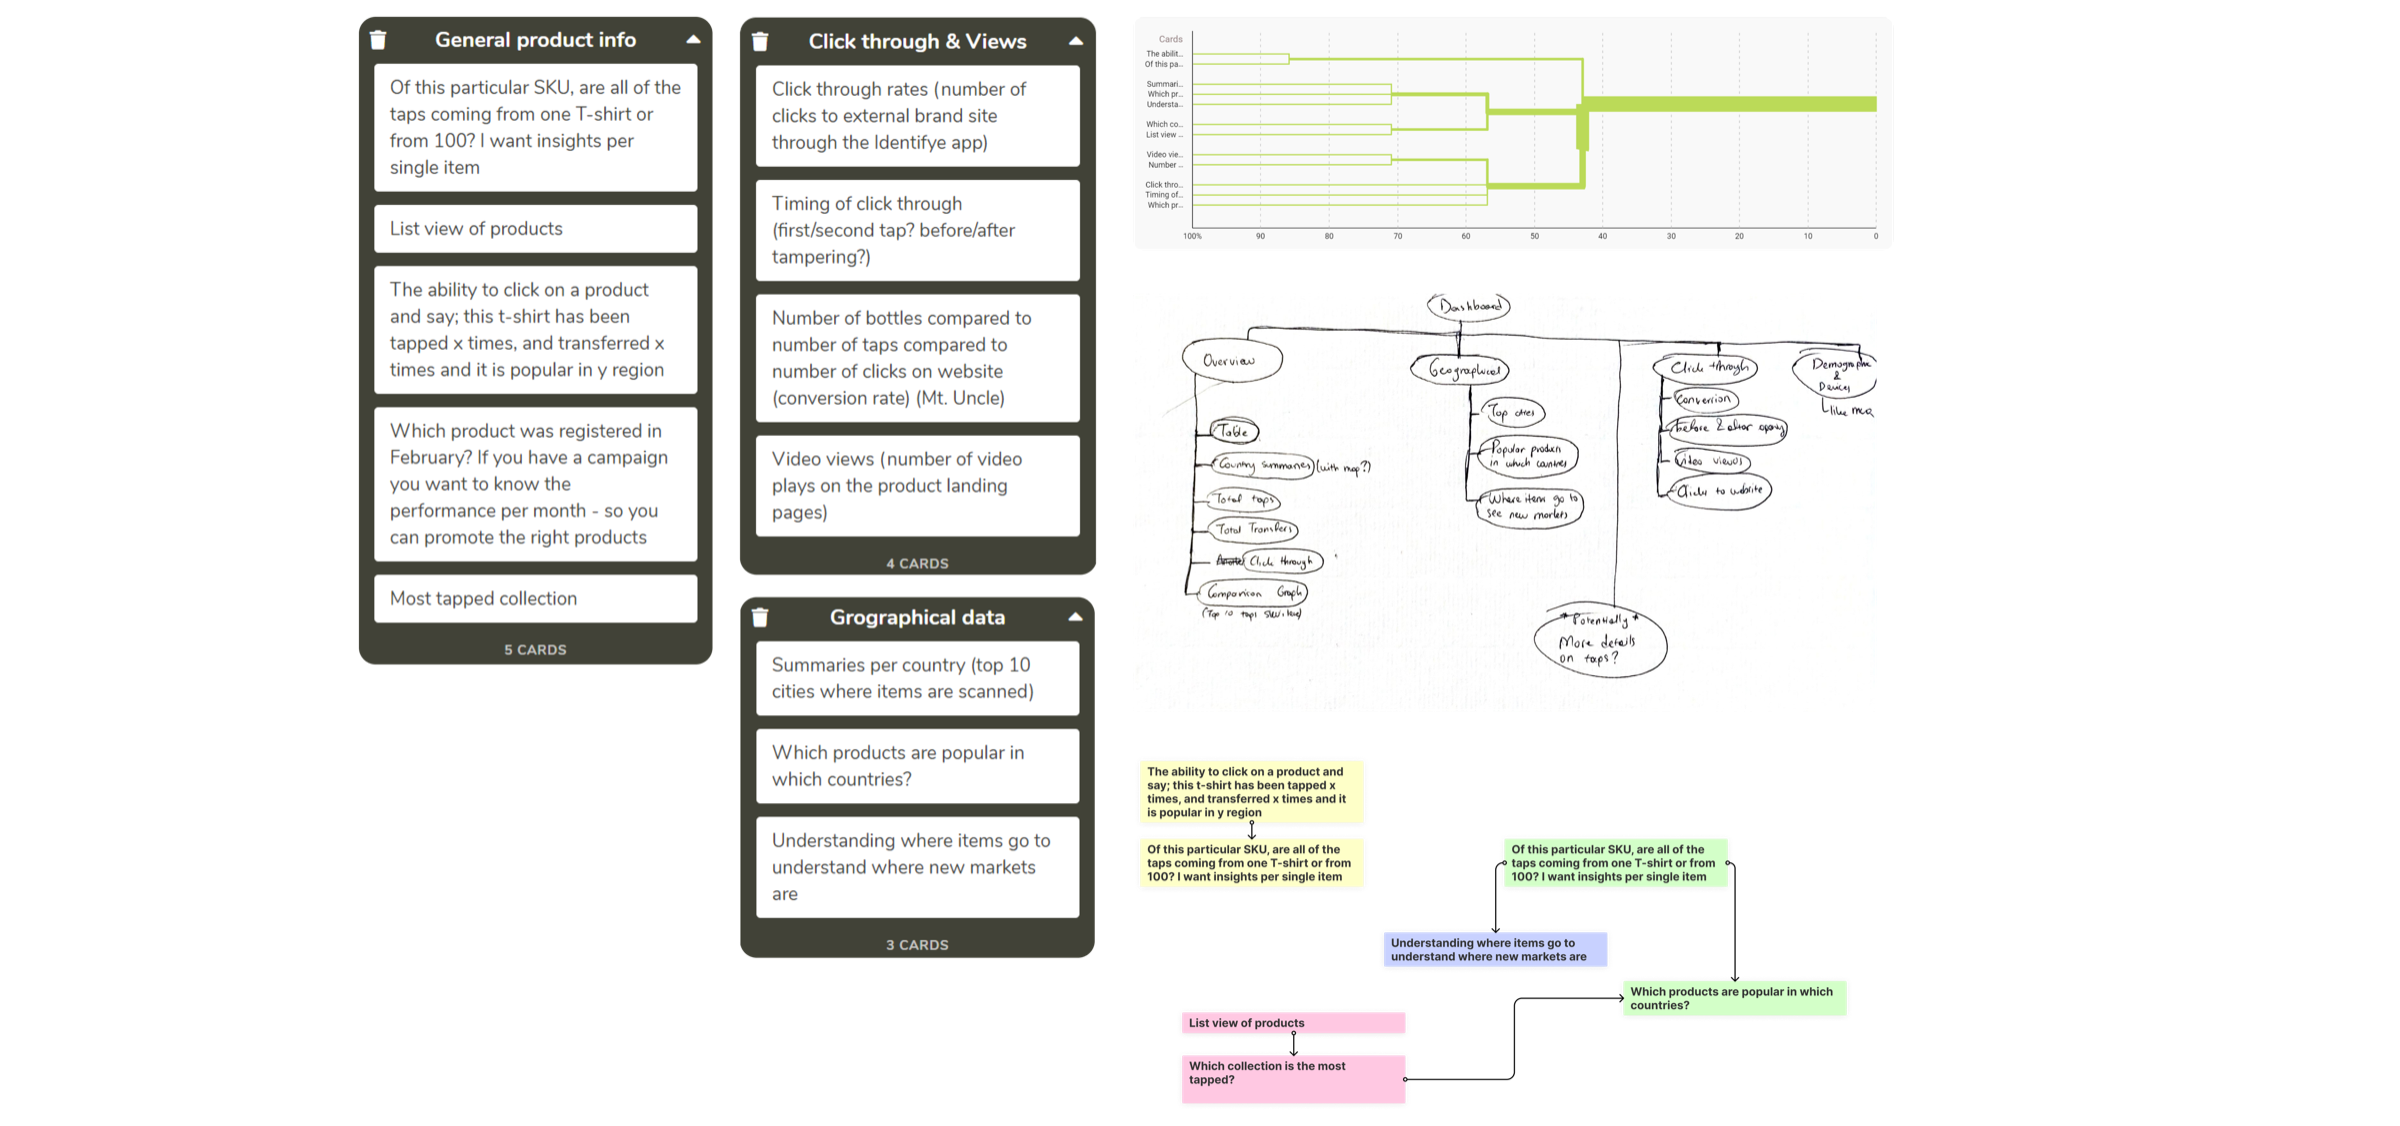
Information architecture
After identifying our users, I conducted a card sorting study to gain a better understanding of what information was most important to them and how they wanted the analytics dashboard to be structured.
Through this study, I was able to identify common themes and groupings of information, which informed the information architecture of the dashboard. This allowed us to prioritize the most important information and structure it in a logical and intuitive way, resulting in a dashboard that was both easy to use and provided valuable insights.
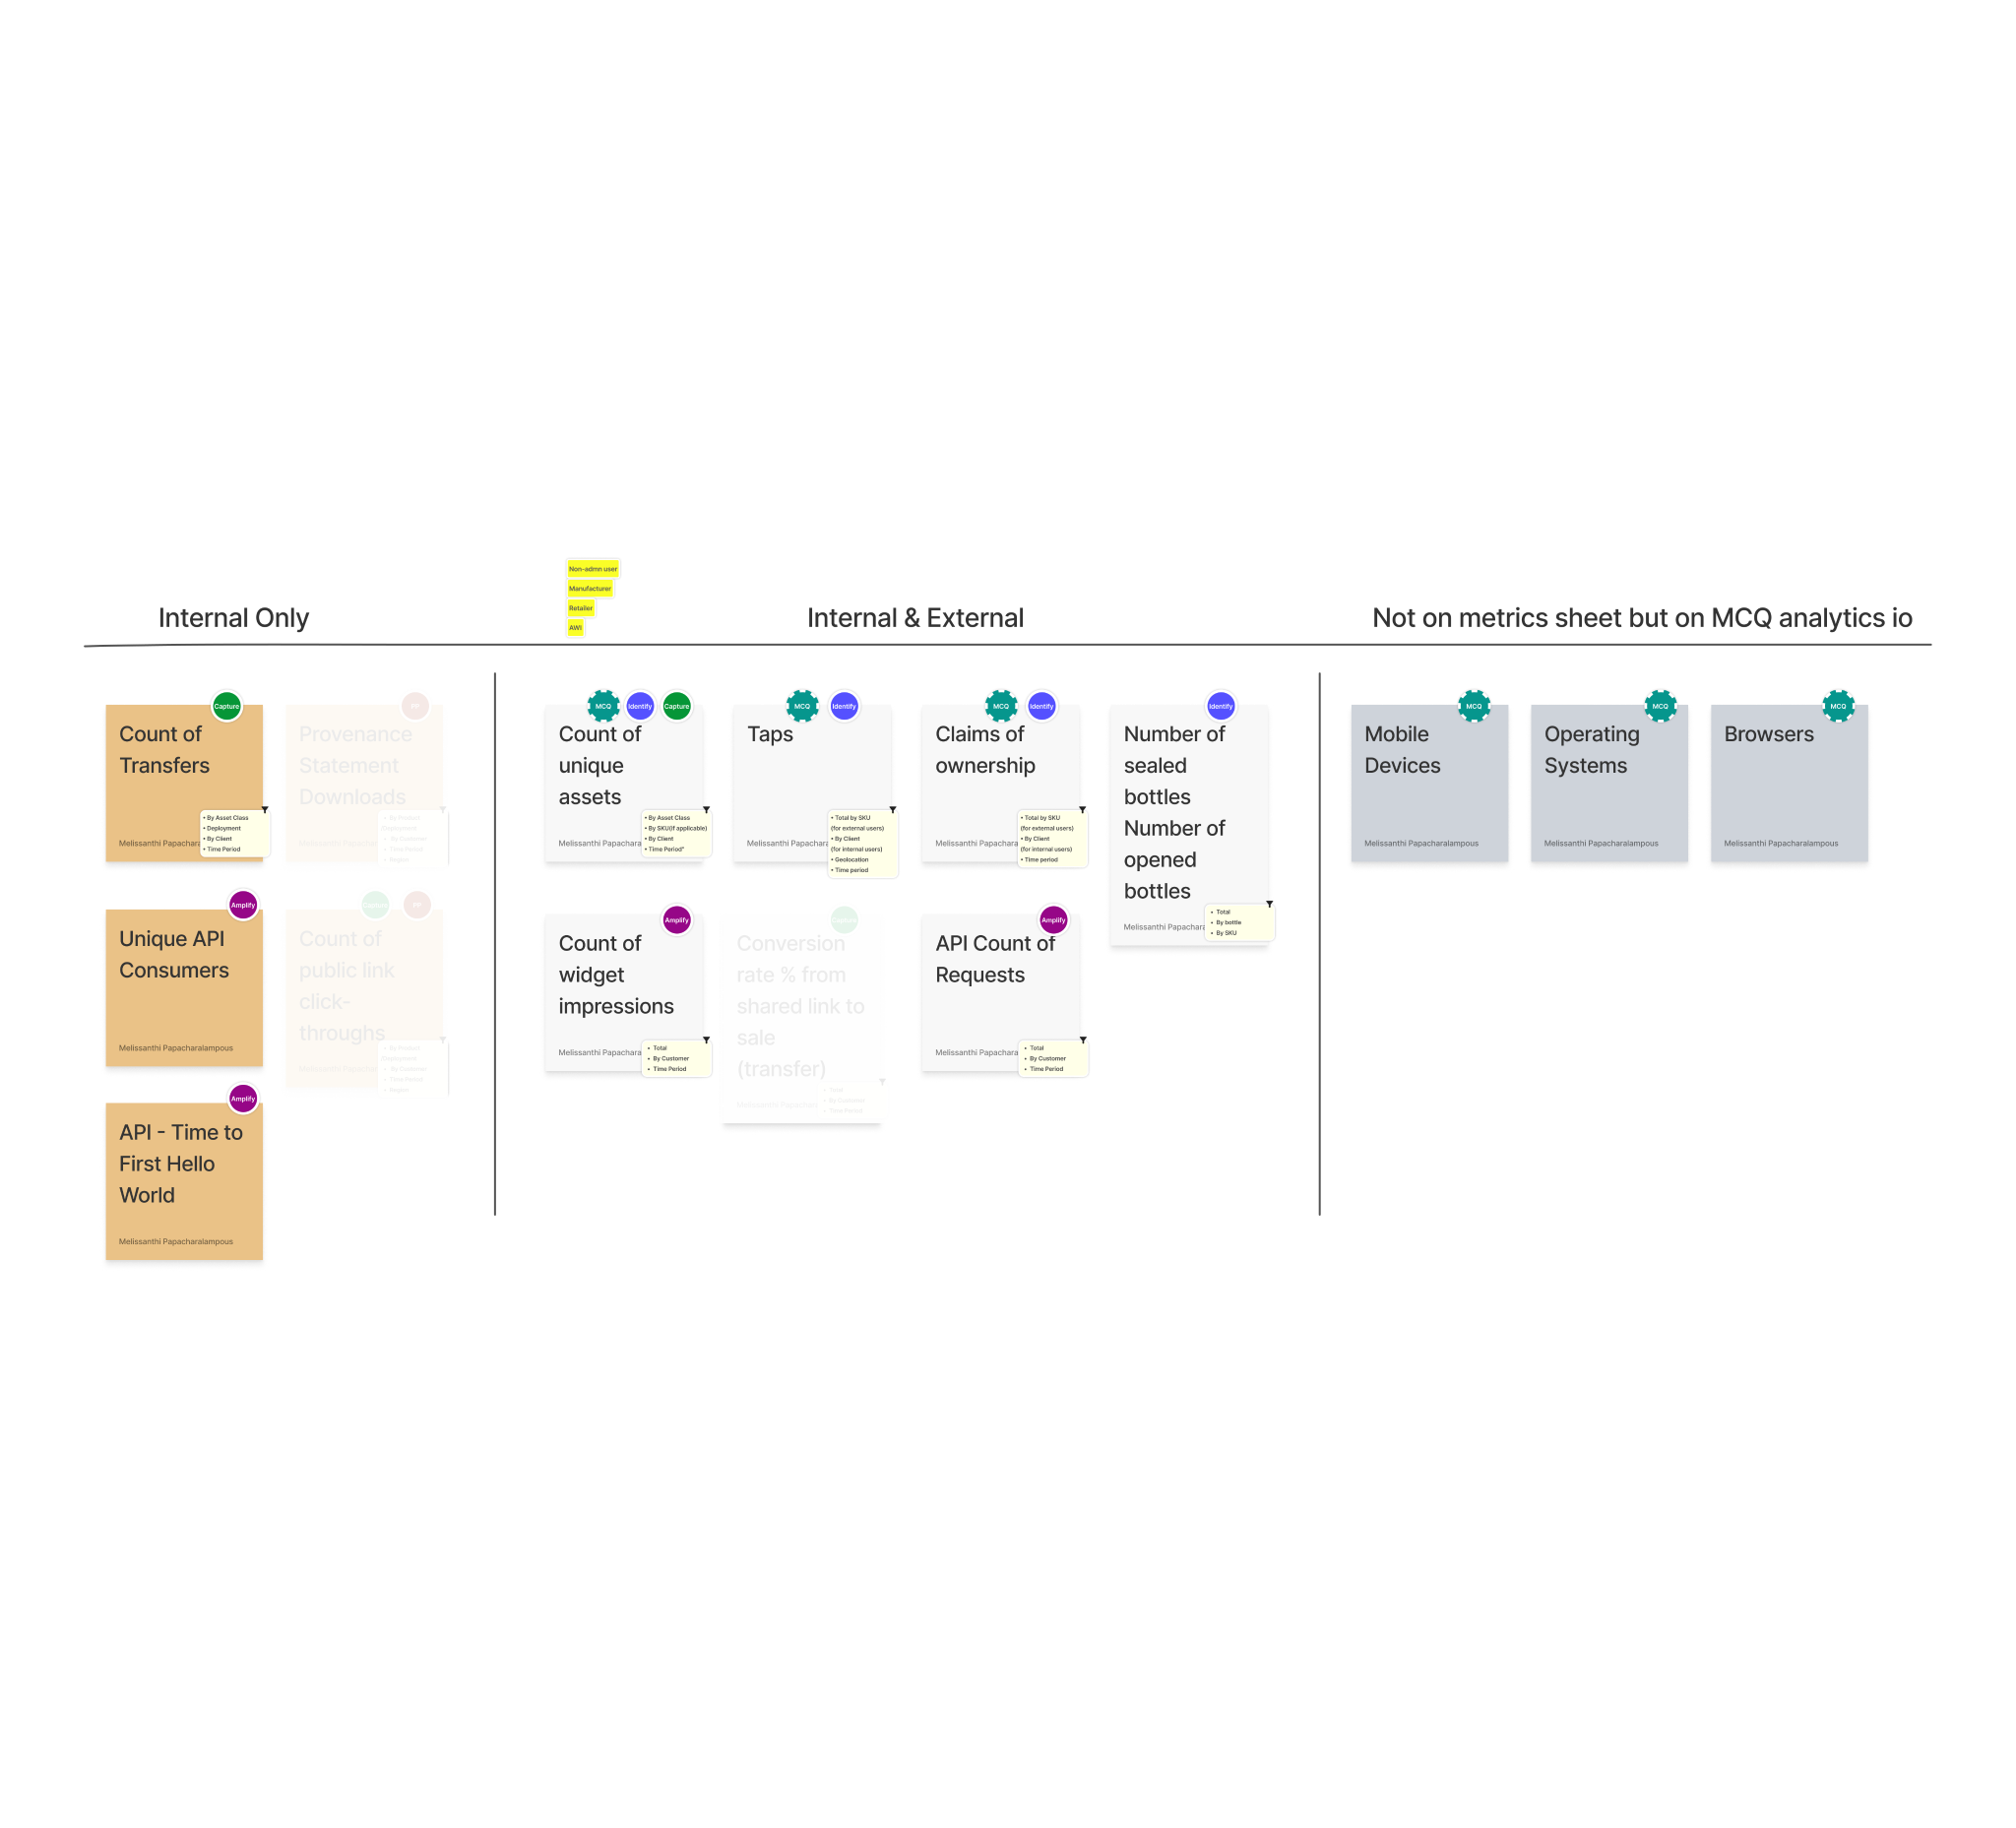
Shifting project goals
As a UX designer, I understood the importance of conducting research and gathering insights to create a successful analytics dashboard. However, the project had to be put on hold due to a change in business goals, which required the dashboard to be available to all platform users. To design a consistent dashboard for all users, I conducted workshops with relevant stakeholders and did extensive research to define how many dashboard variations we should create for Phase 1.
To organize my research findings, I used Dovetail to tag and categorize the data. This allowed me to synthesize the data, ask questions, and simplify the problems at hand. Through this process, we were able to categorize two large groups: internal and external users, which we further broke down into sub-categories. This approach enabled us to develop a clear understanding of our users’ needs, preferences, and pain points, which were critical in creating a tailored dashboard that met their needs.
Internal users
For the internal users, the Everledger customer success team needed to understand client and user behavior to create billing plans. This was previously a manual and time-consuming process, but the dashboard could provide them with the necessary insights to automate and streamline the process.
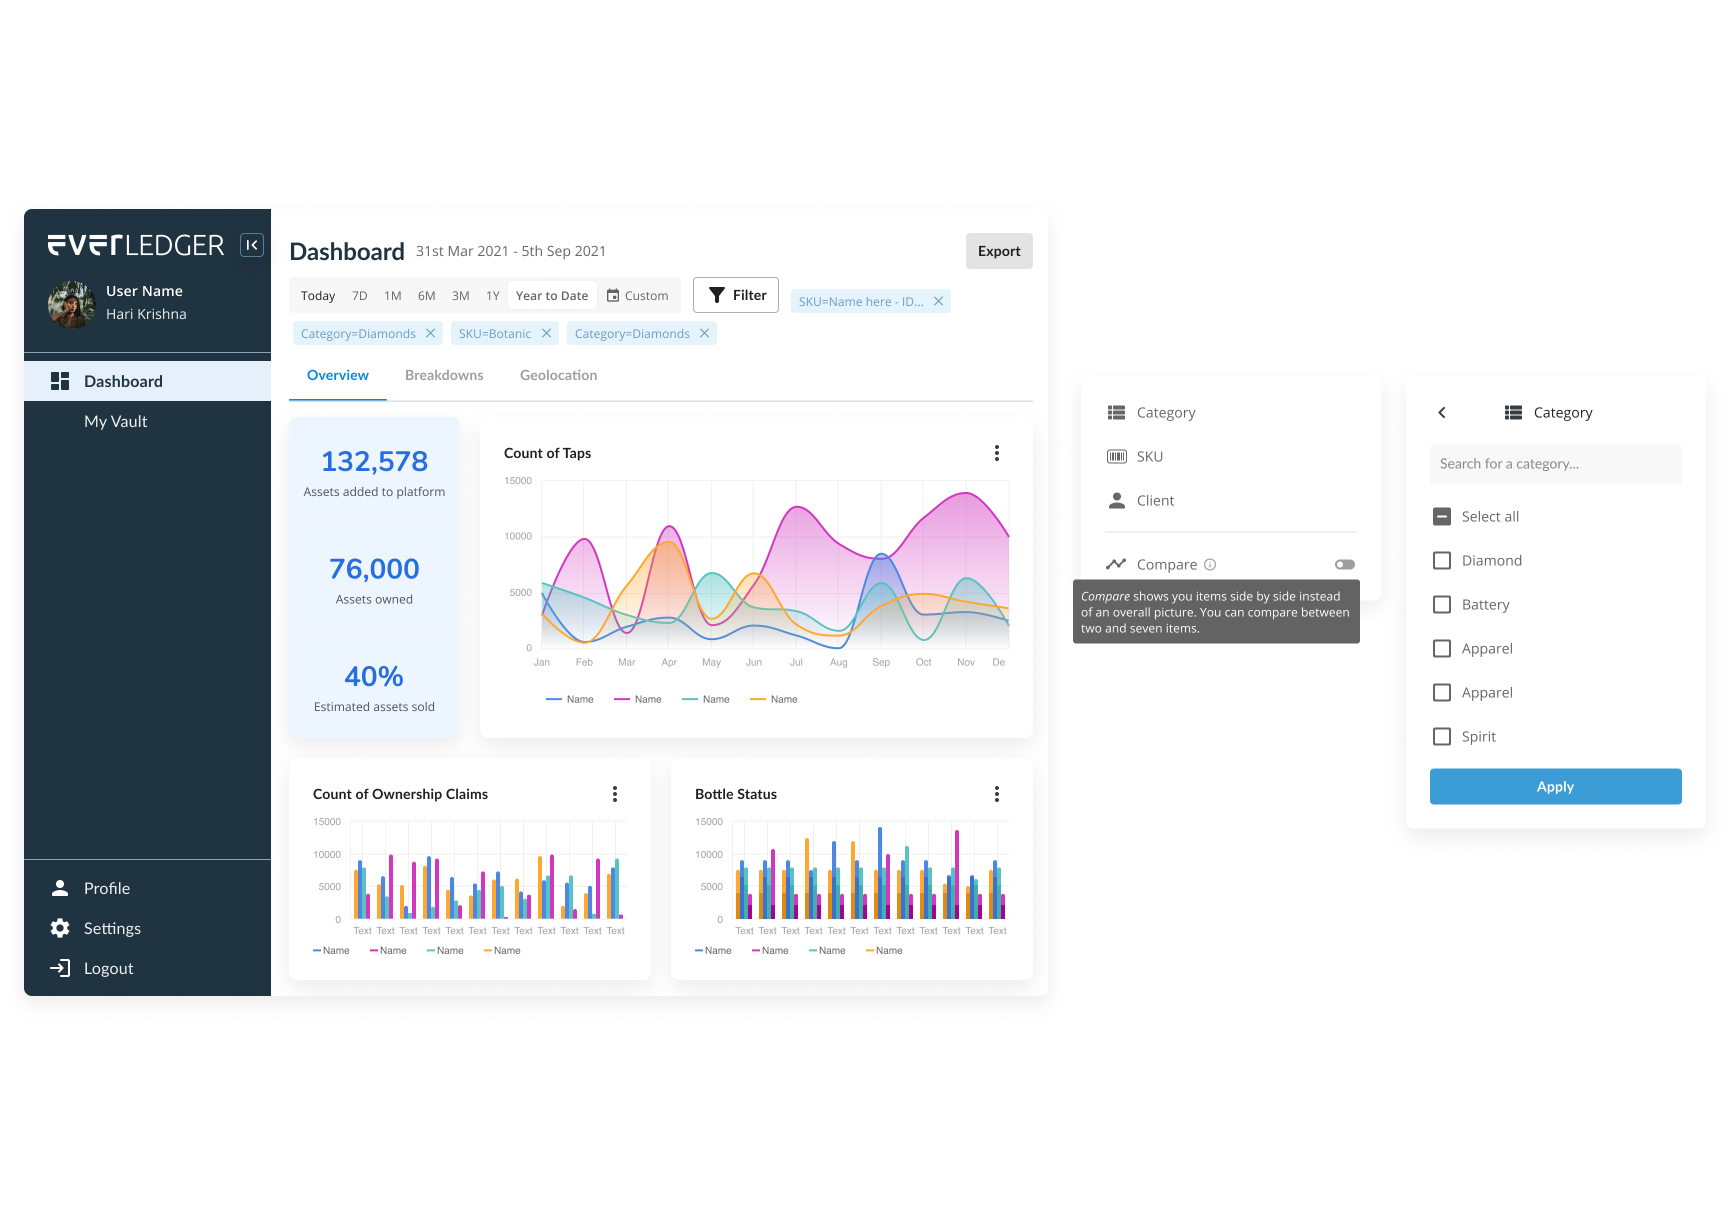
External users
As for external users, there were different motivations for accessing the dashboard, with each sub-group looking for specific information such as sales, inventory, or new market opportunities. To cater to these varied needs, the dashboard needed to provide a snapshot of relevant information for each sub-group in a clear and concise manner.
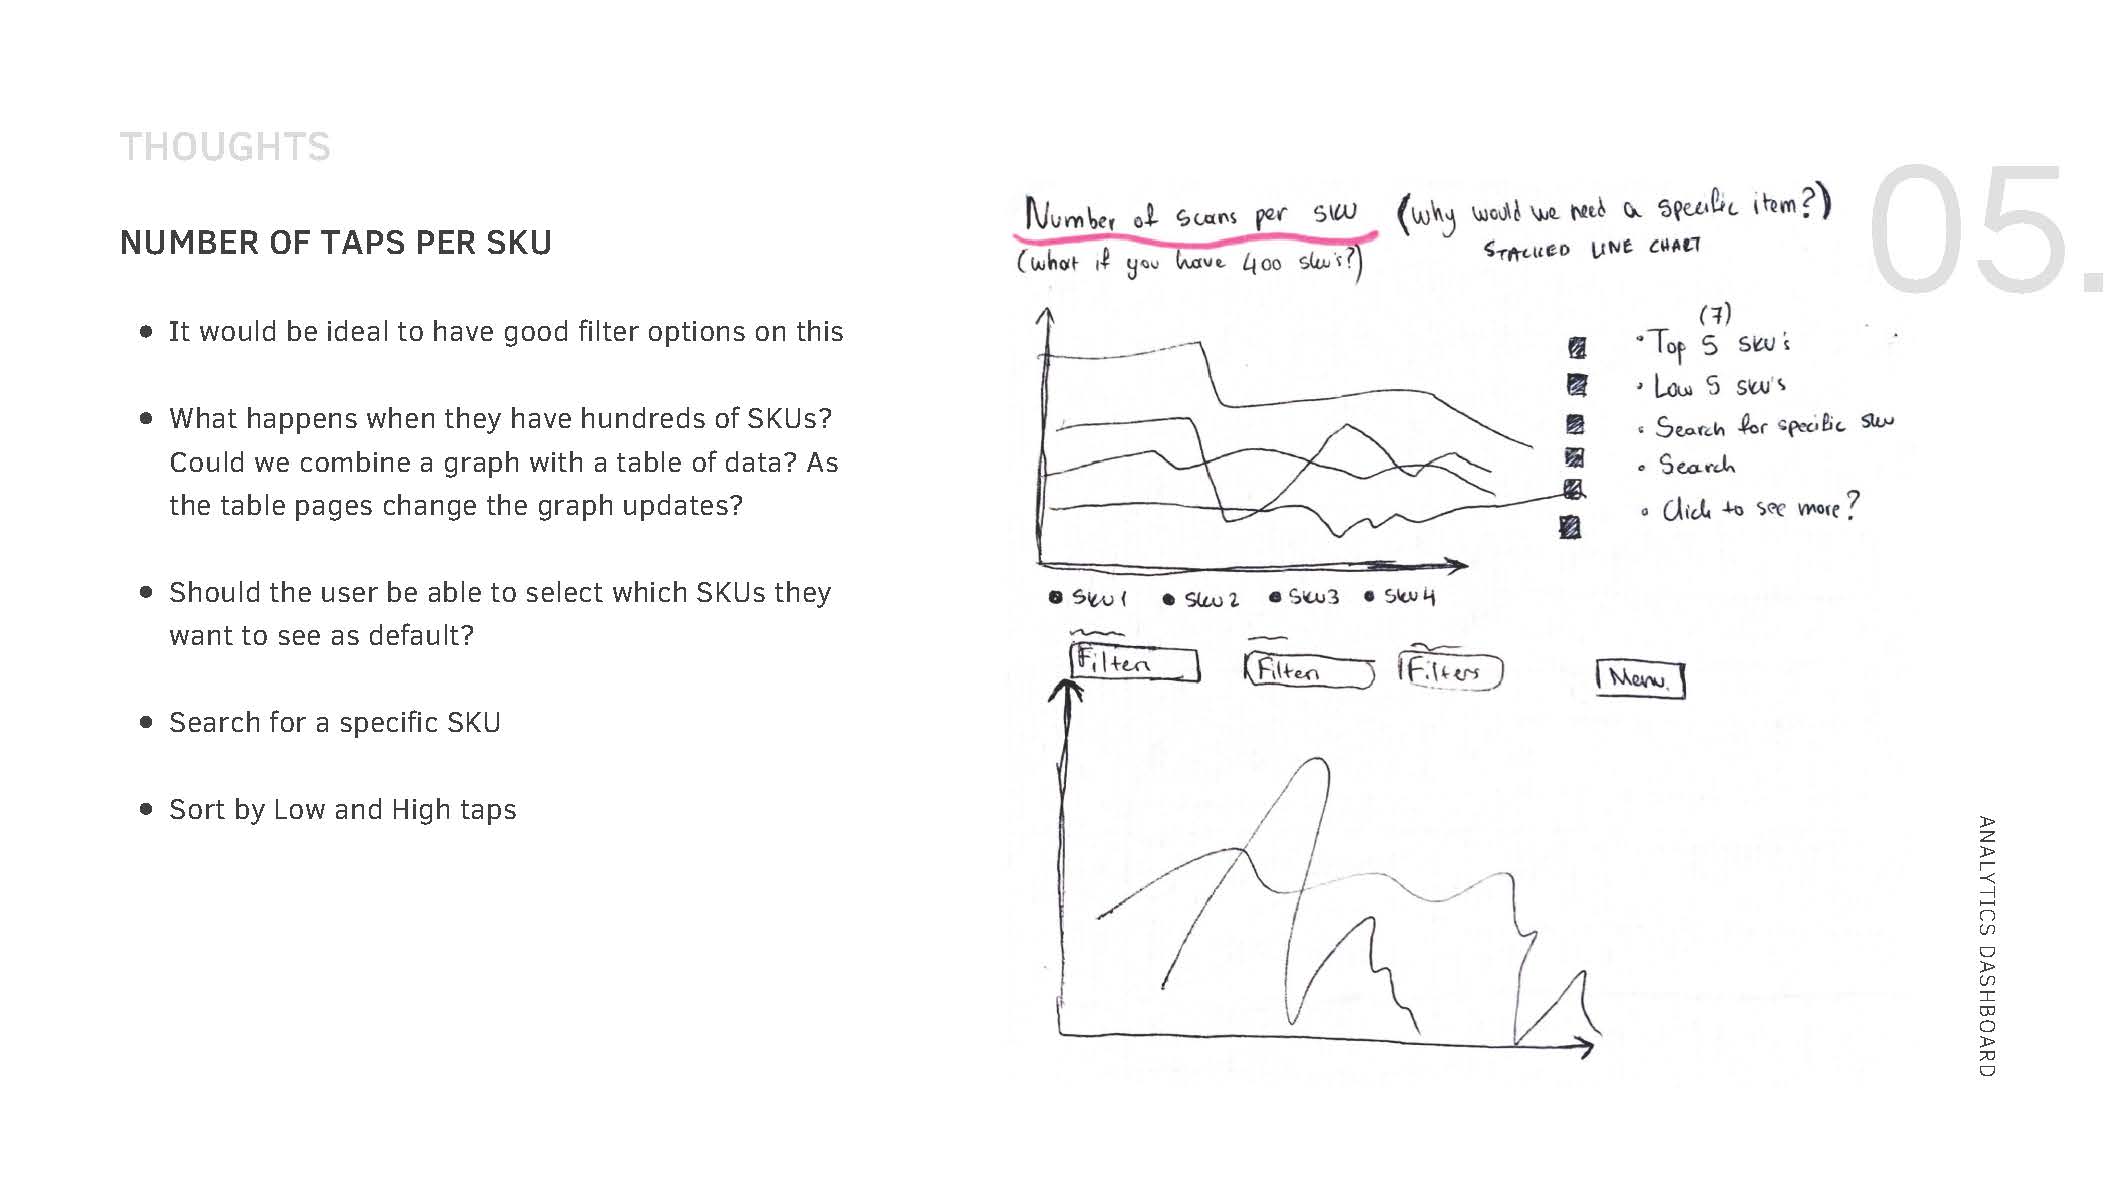
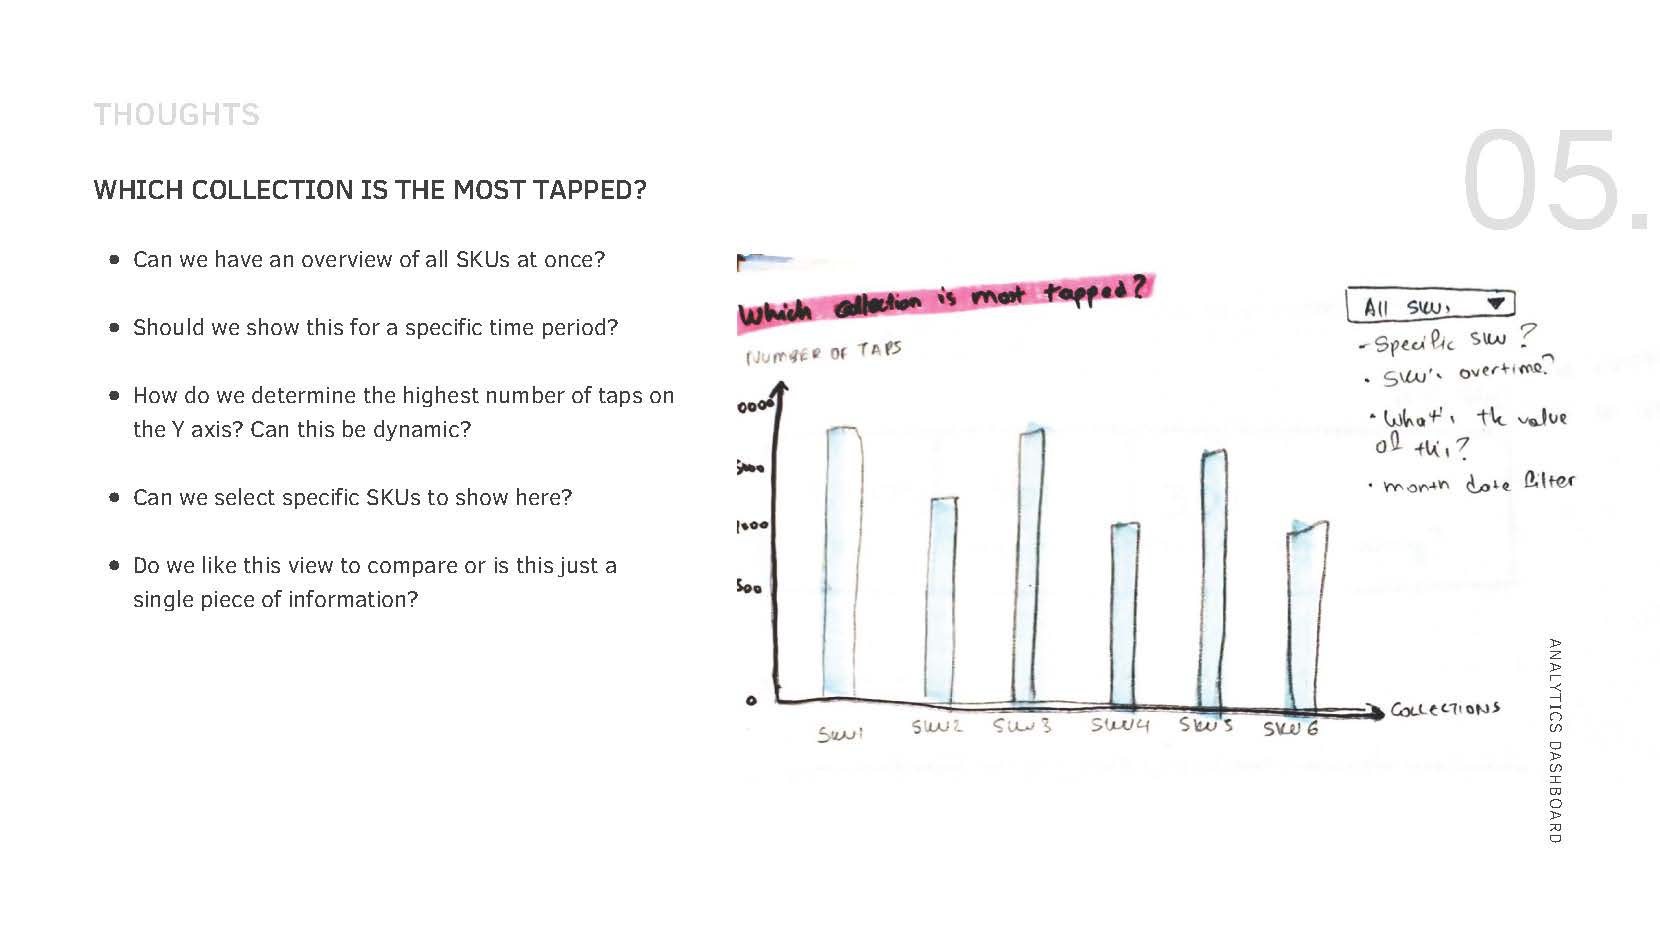
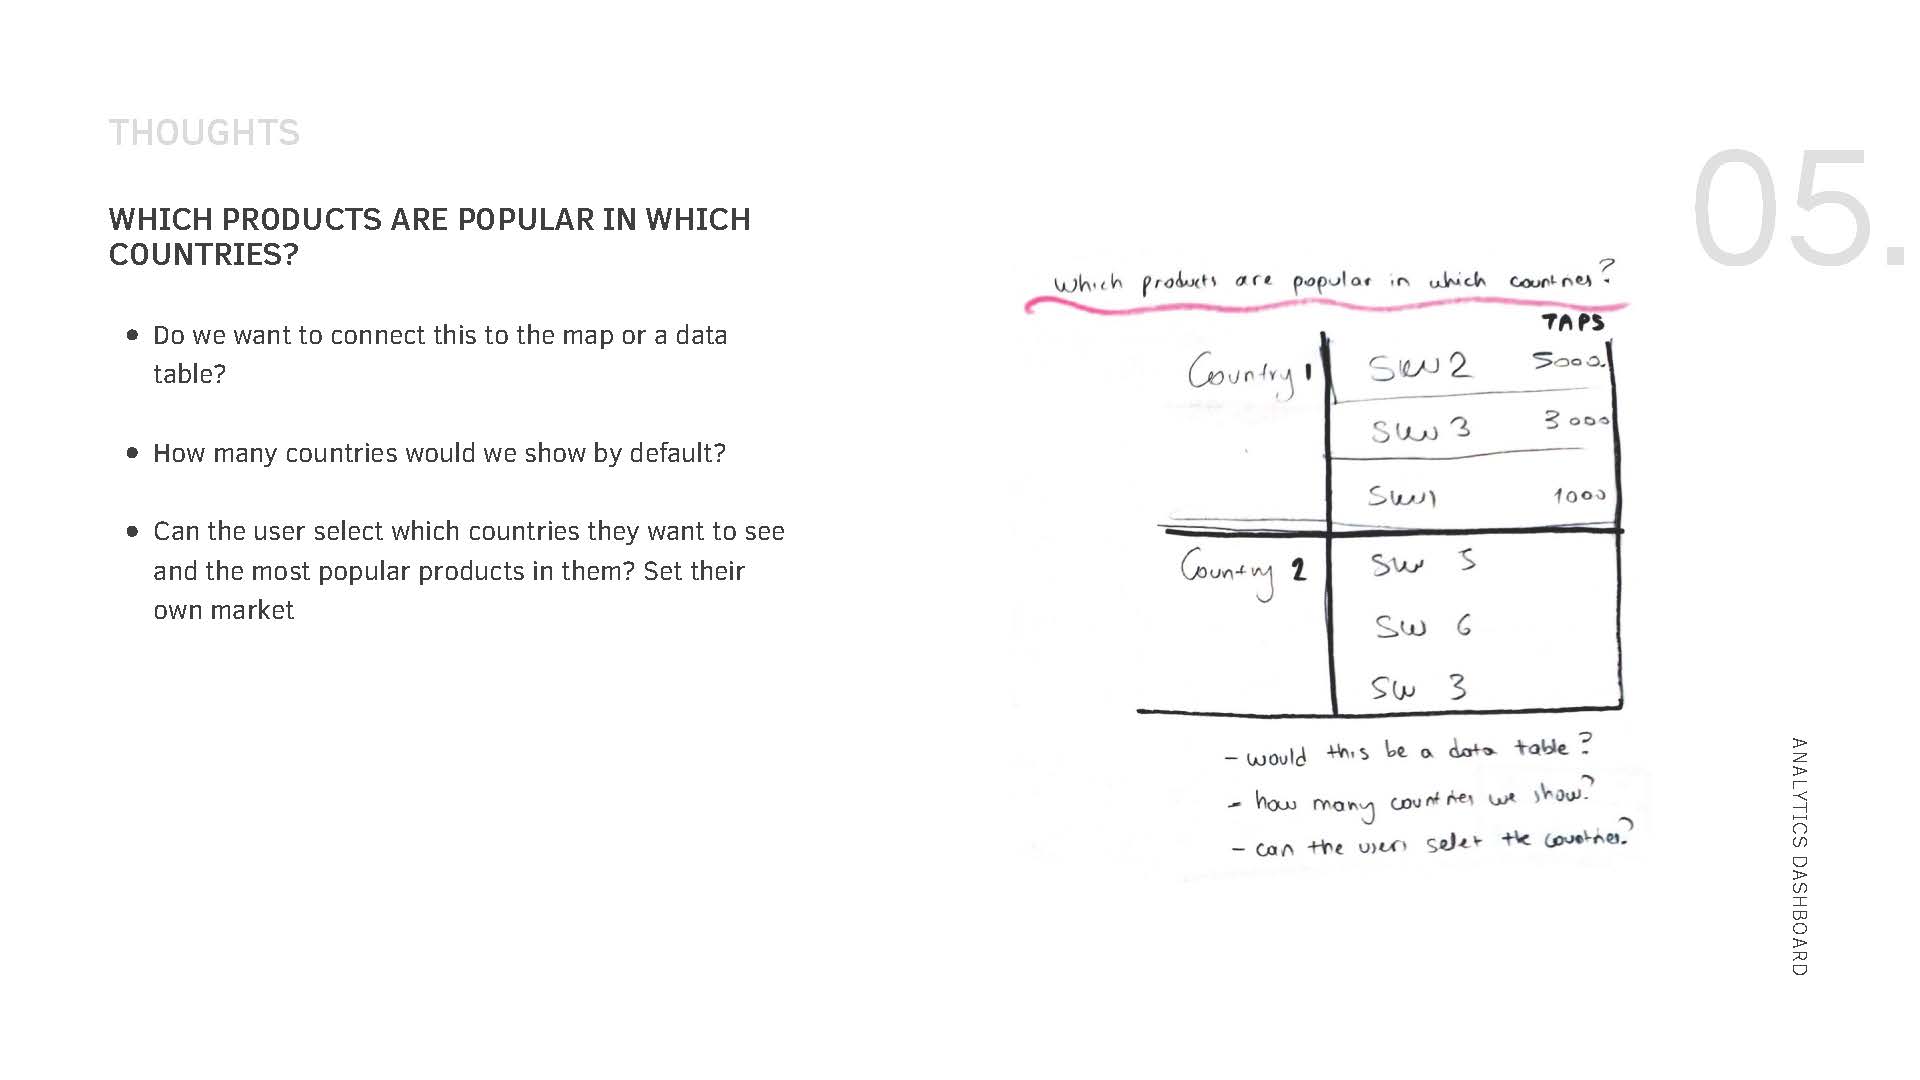
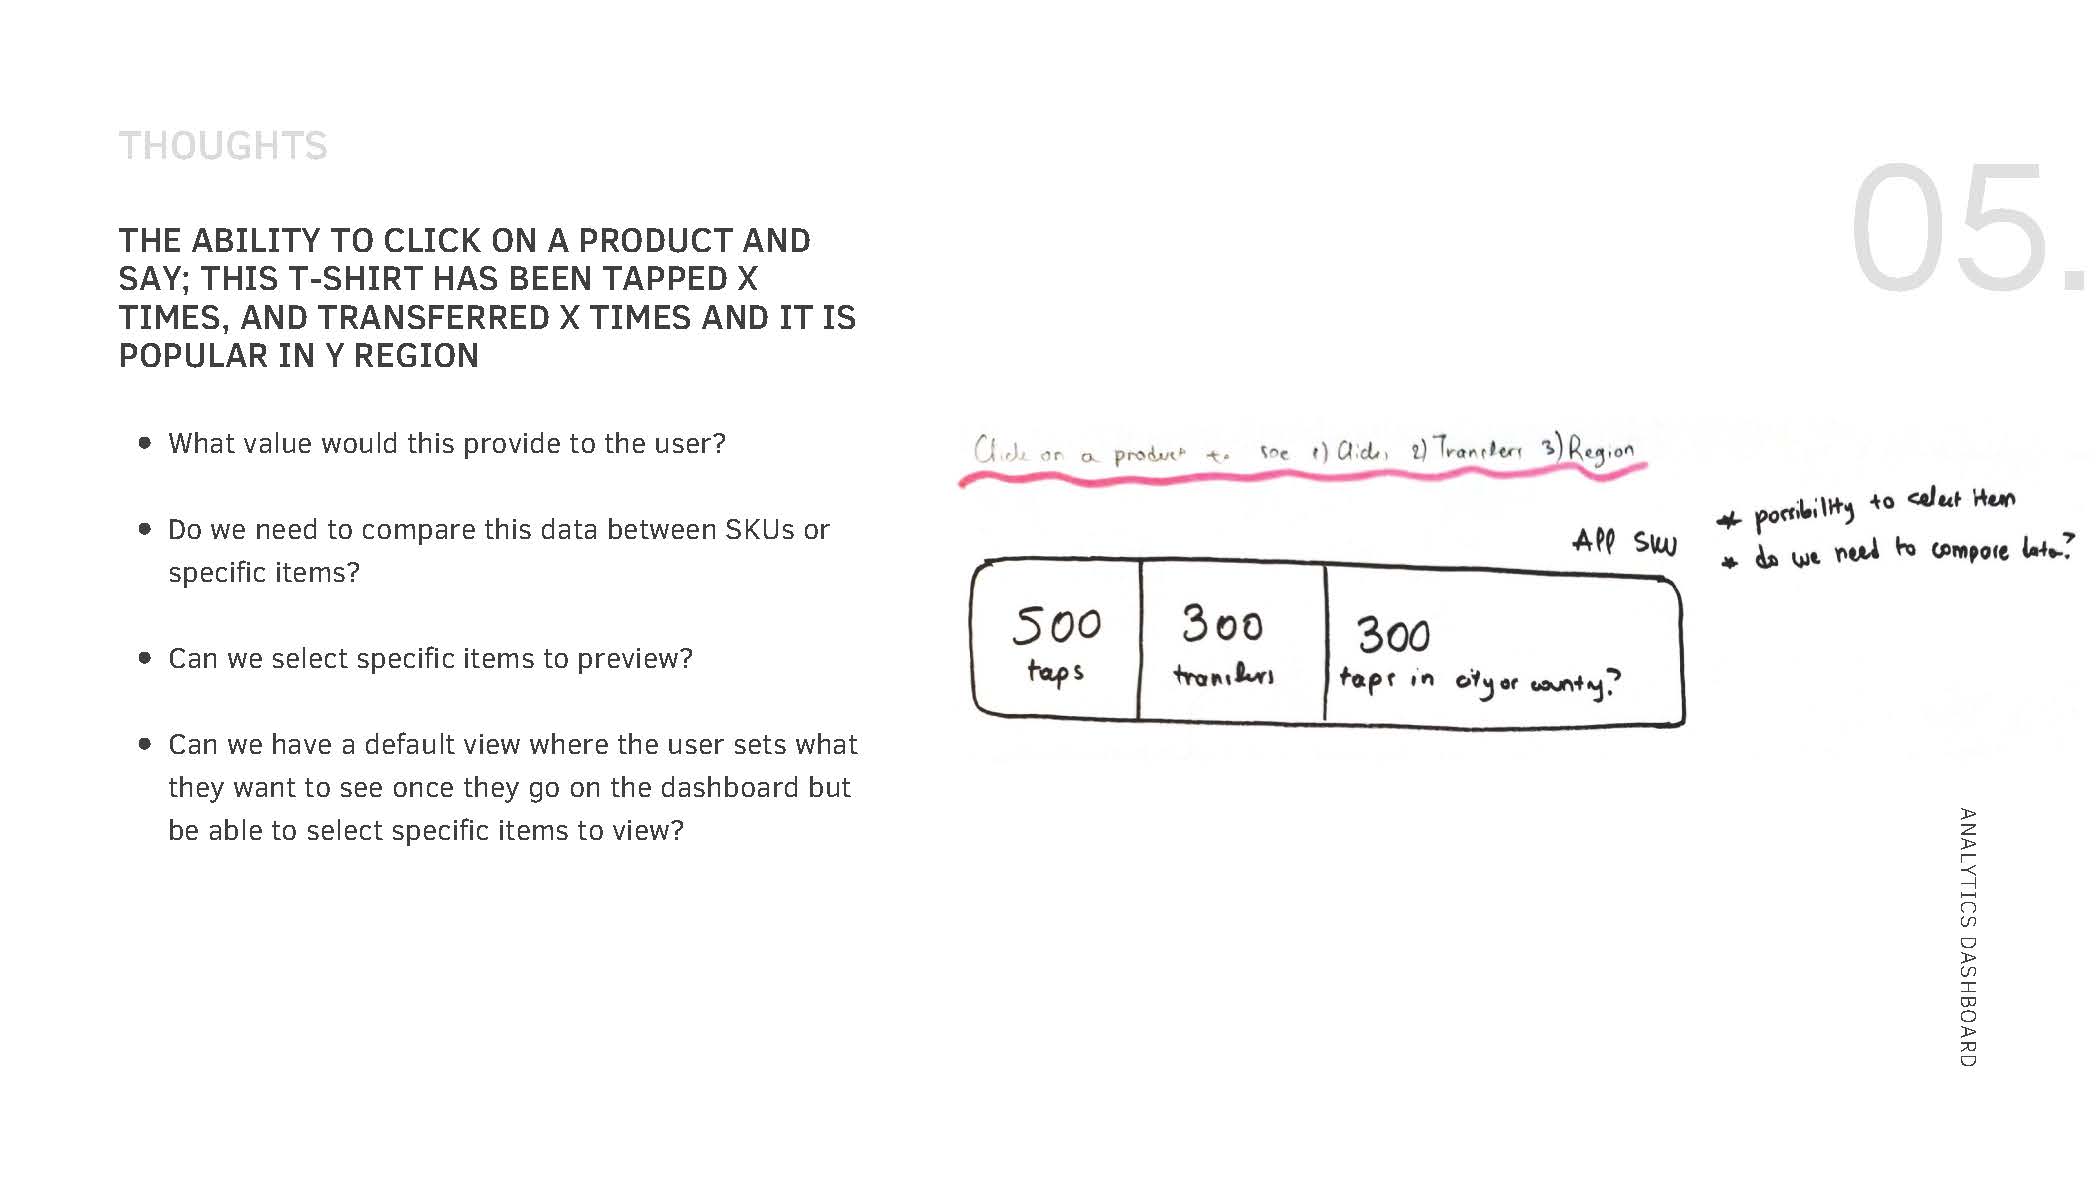
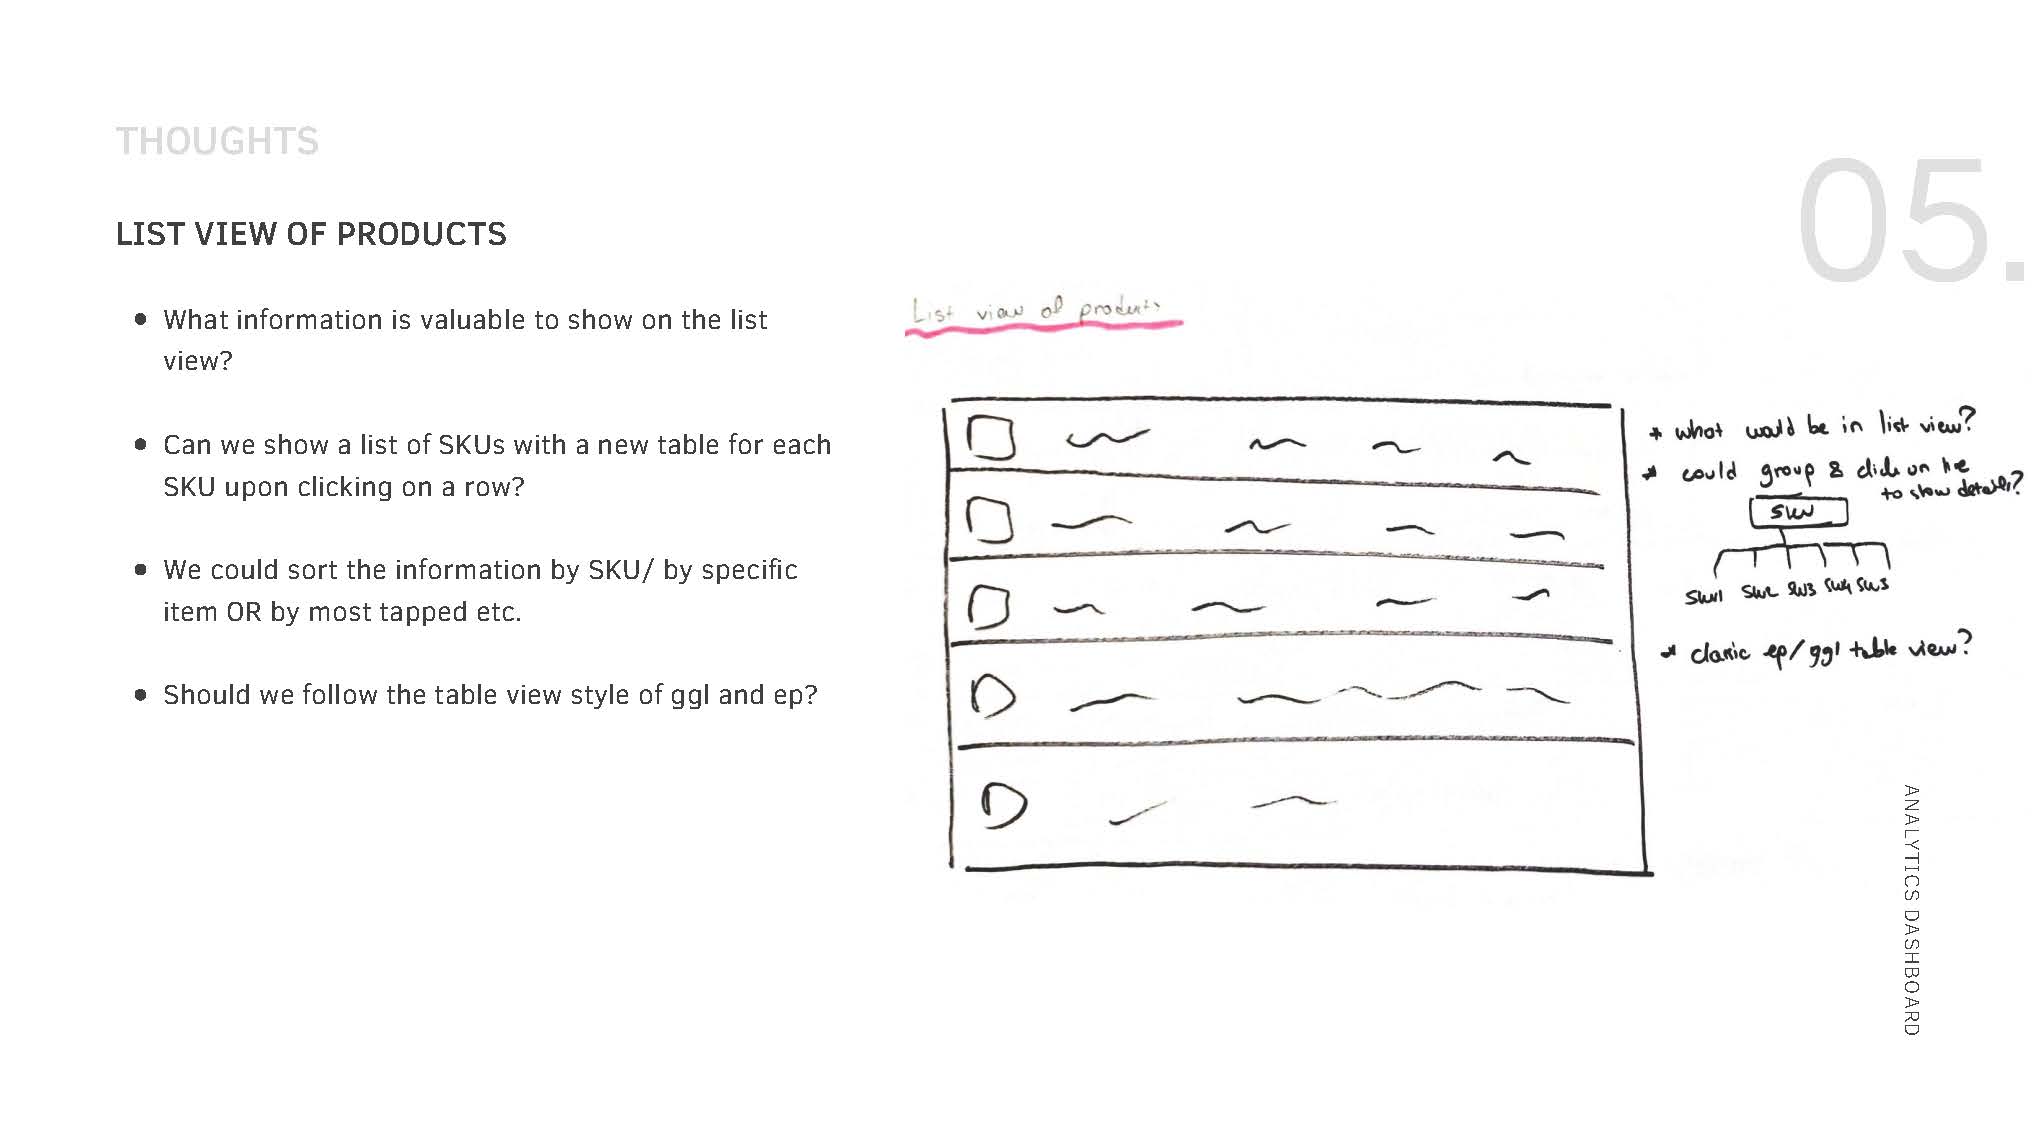
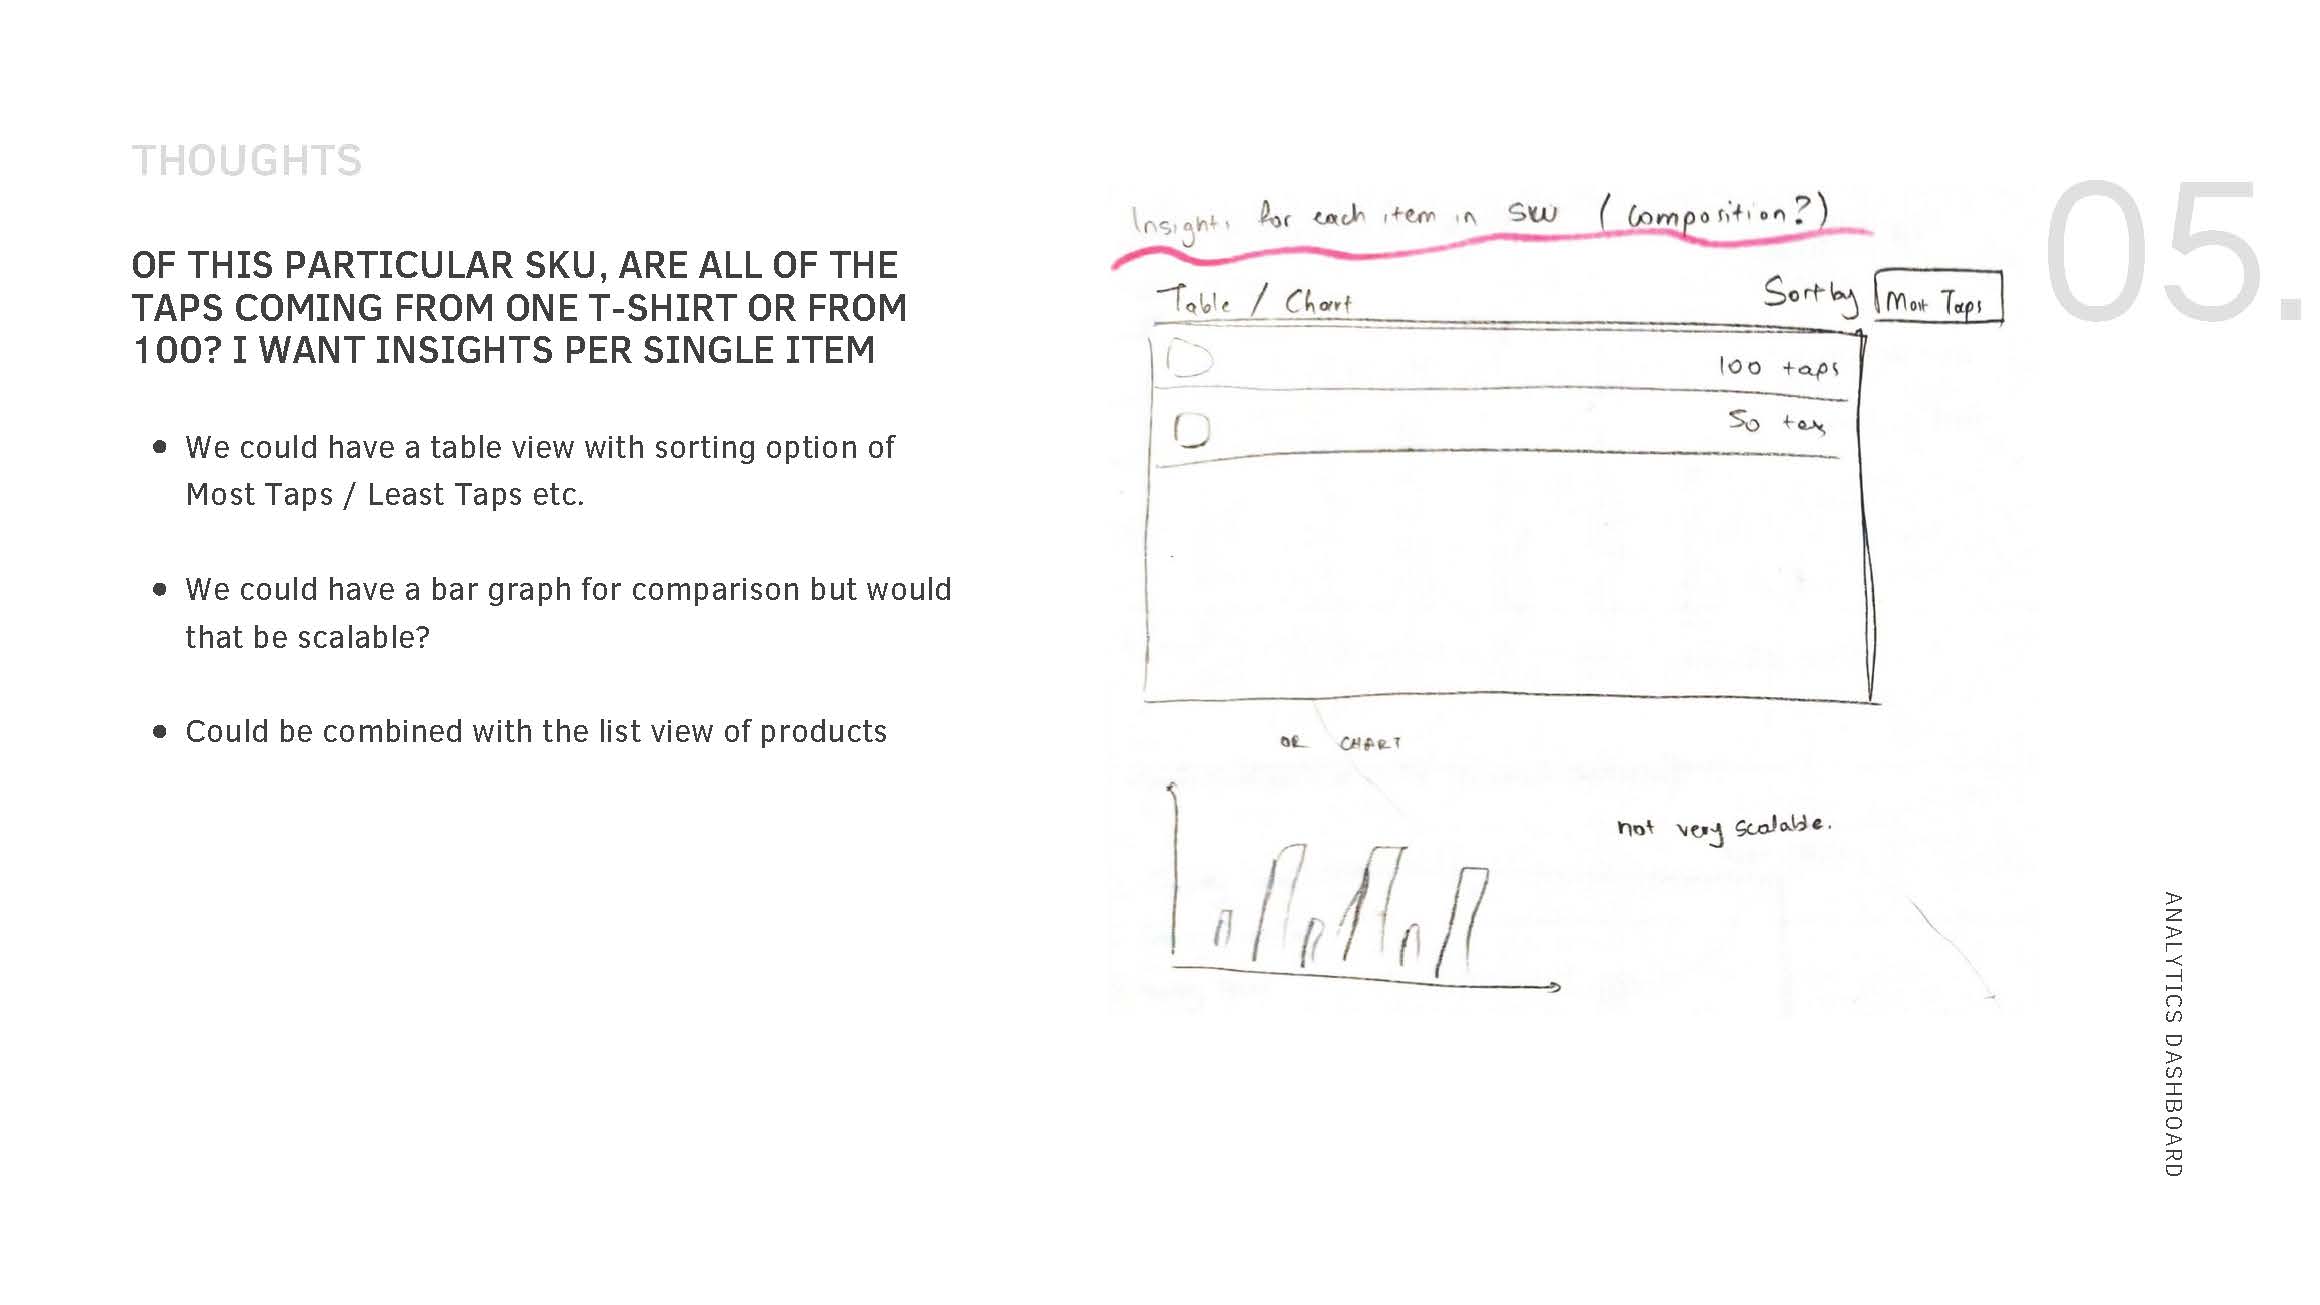
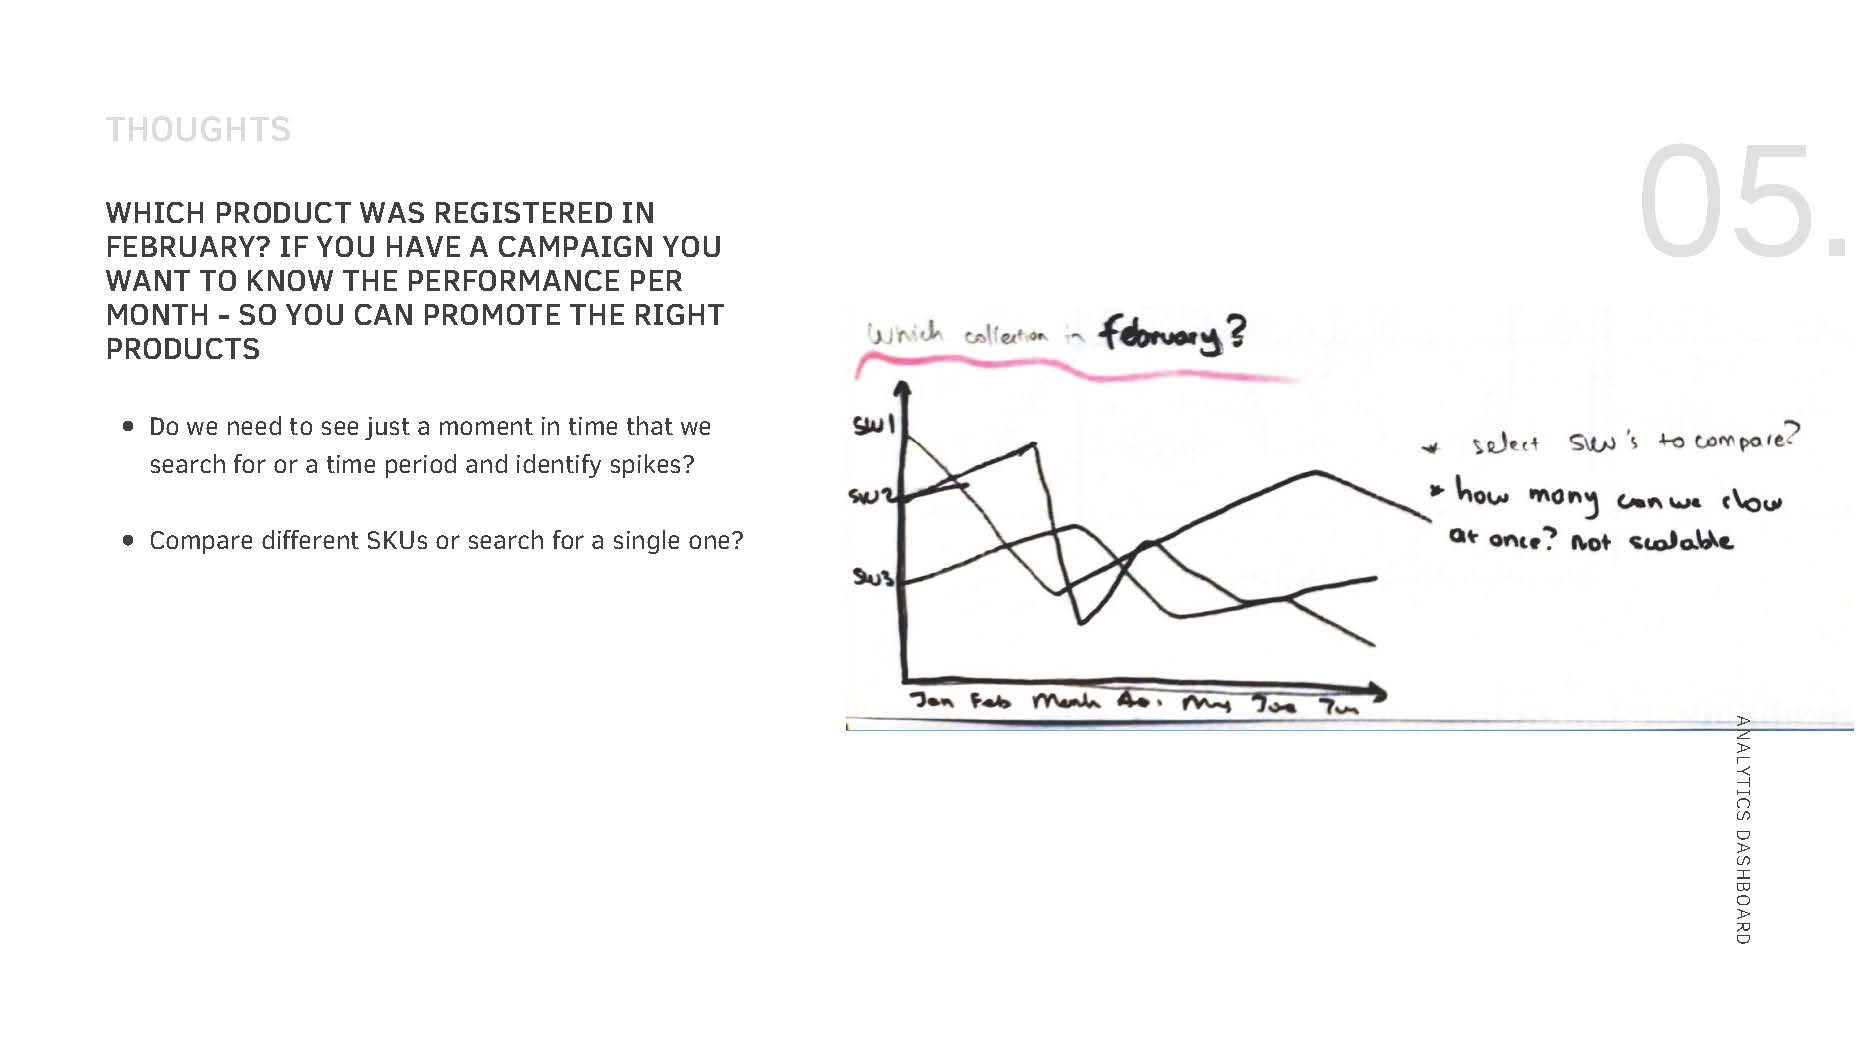
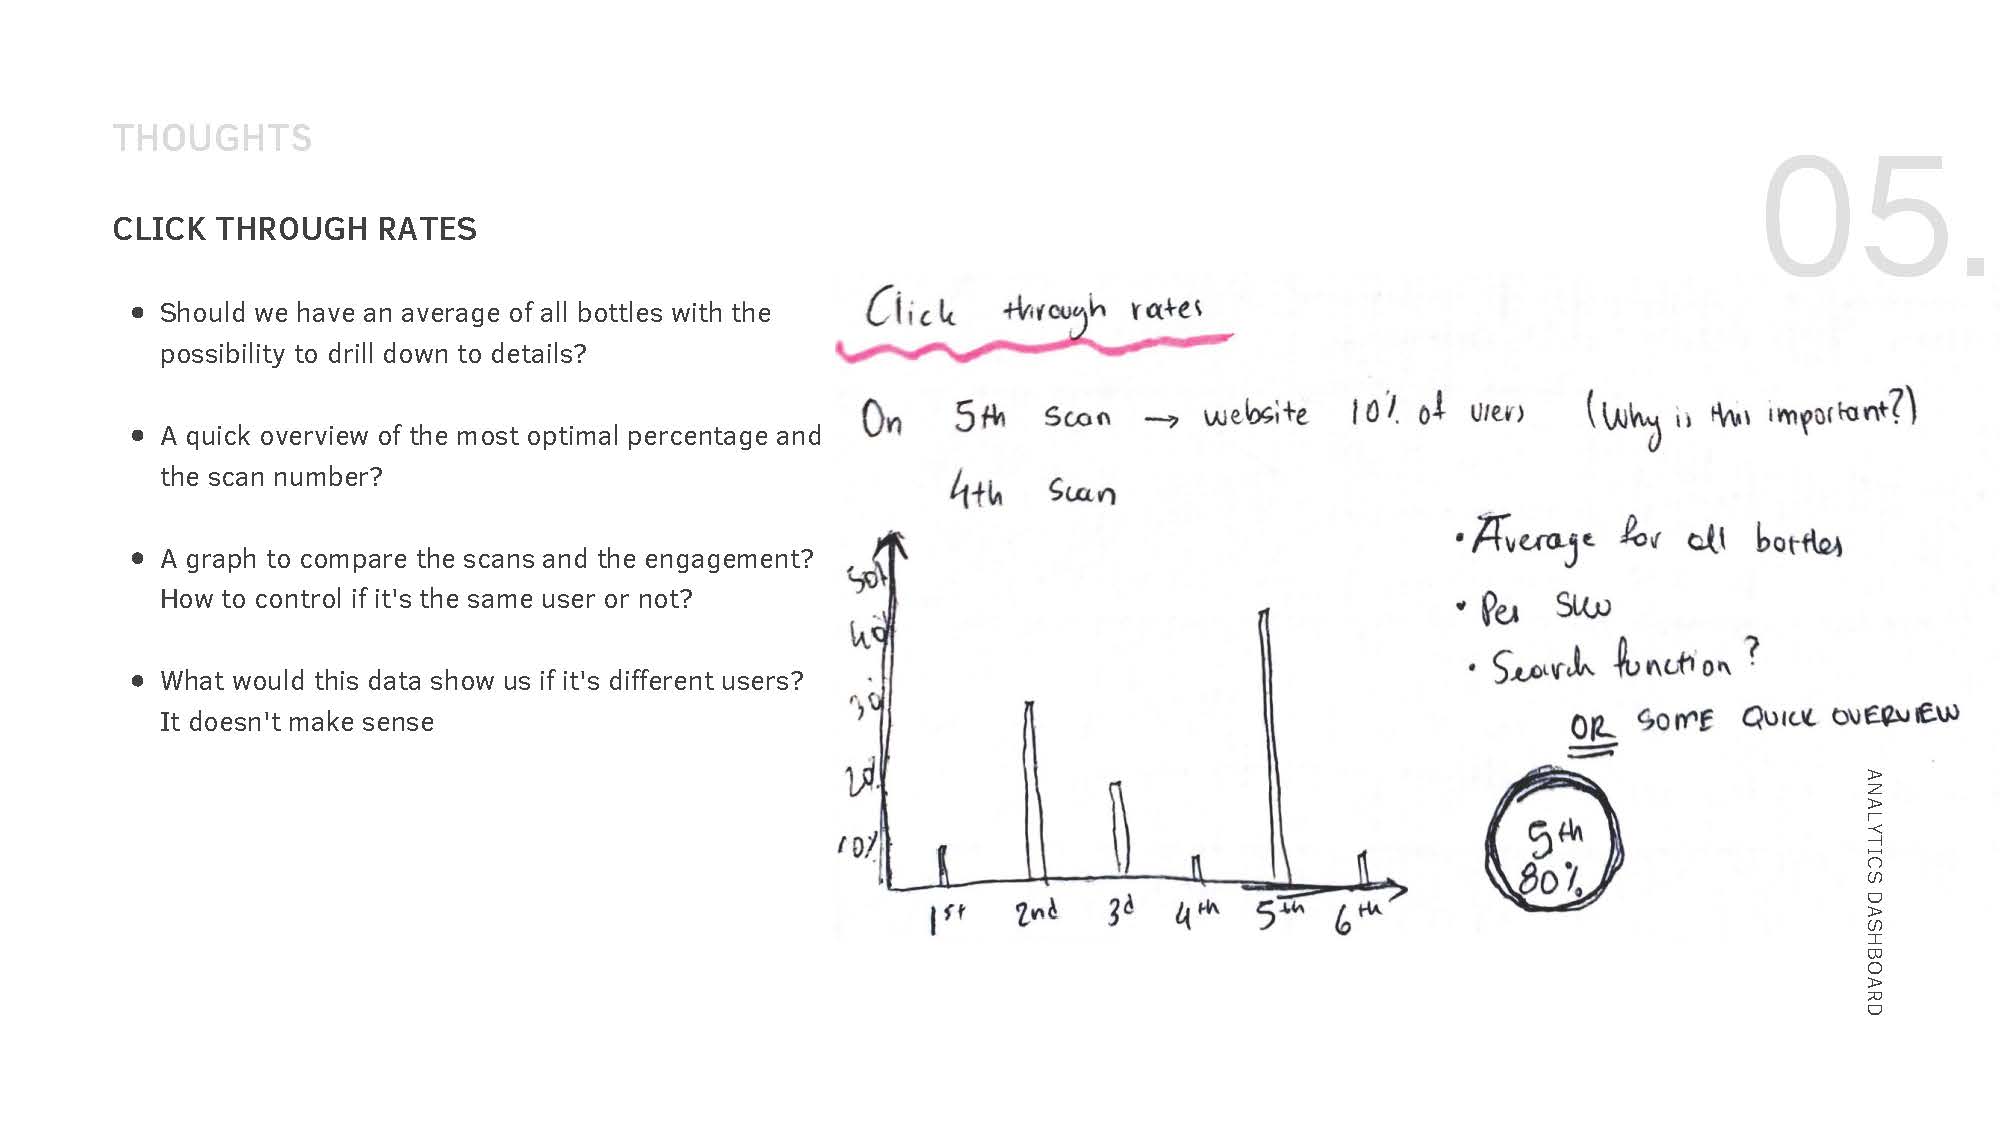
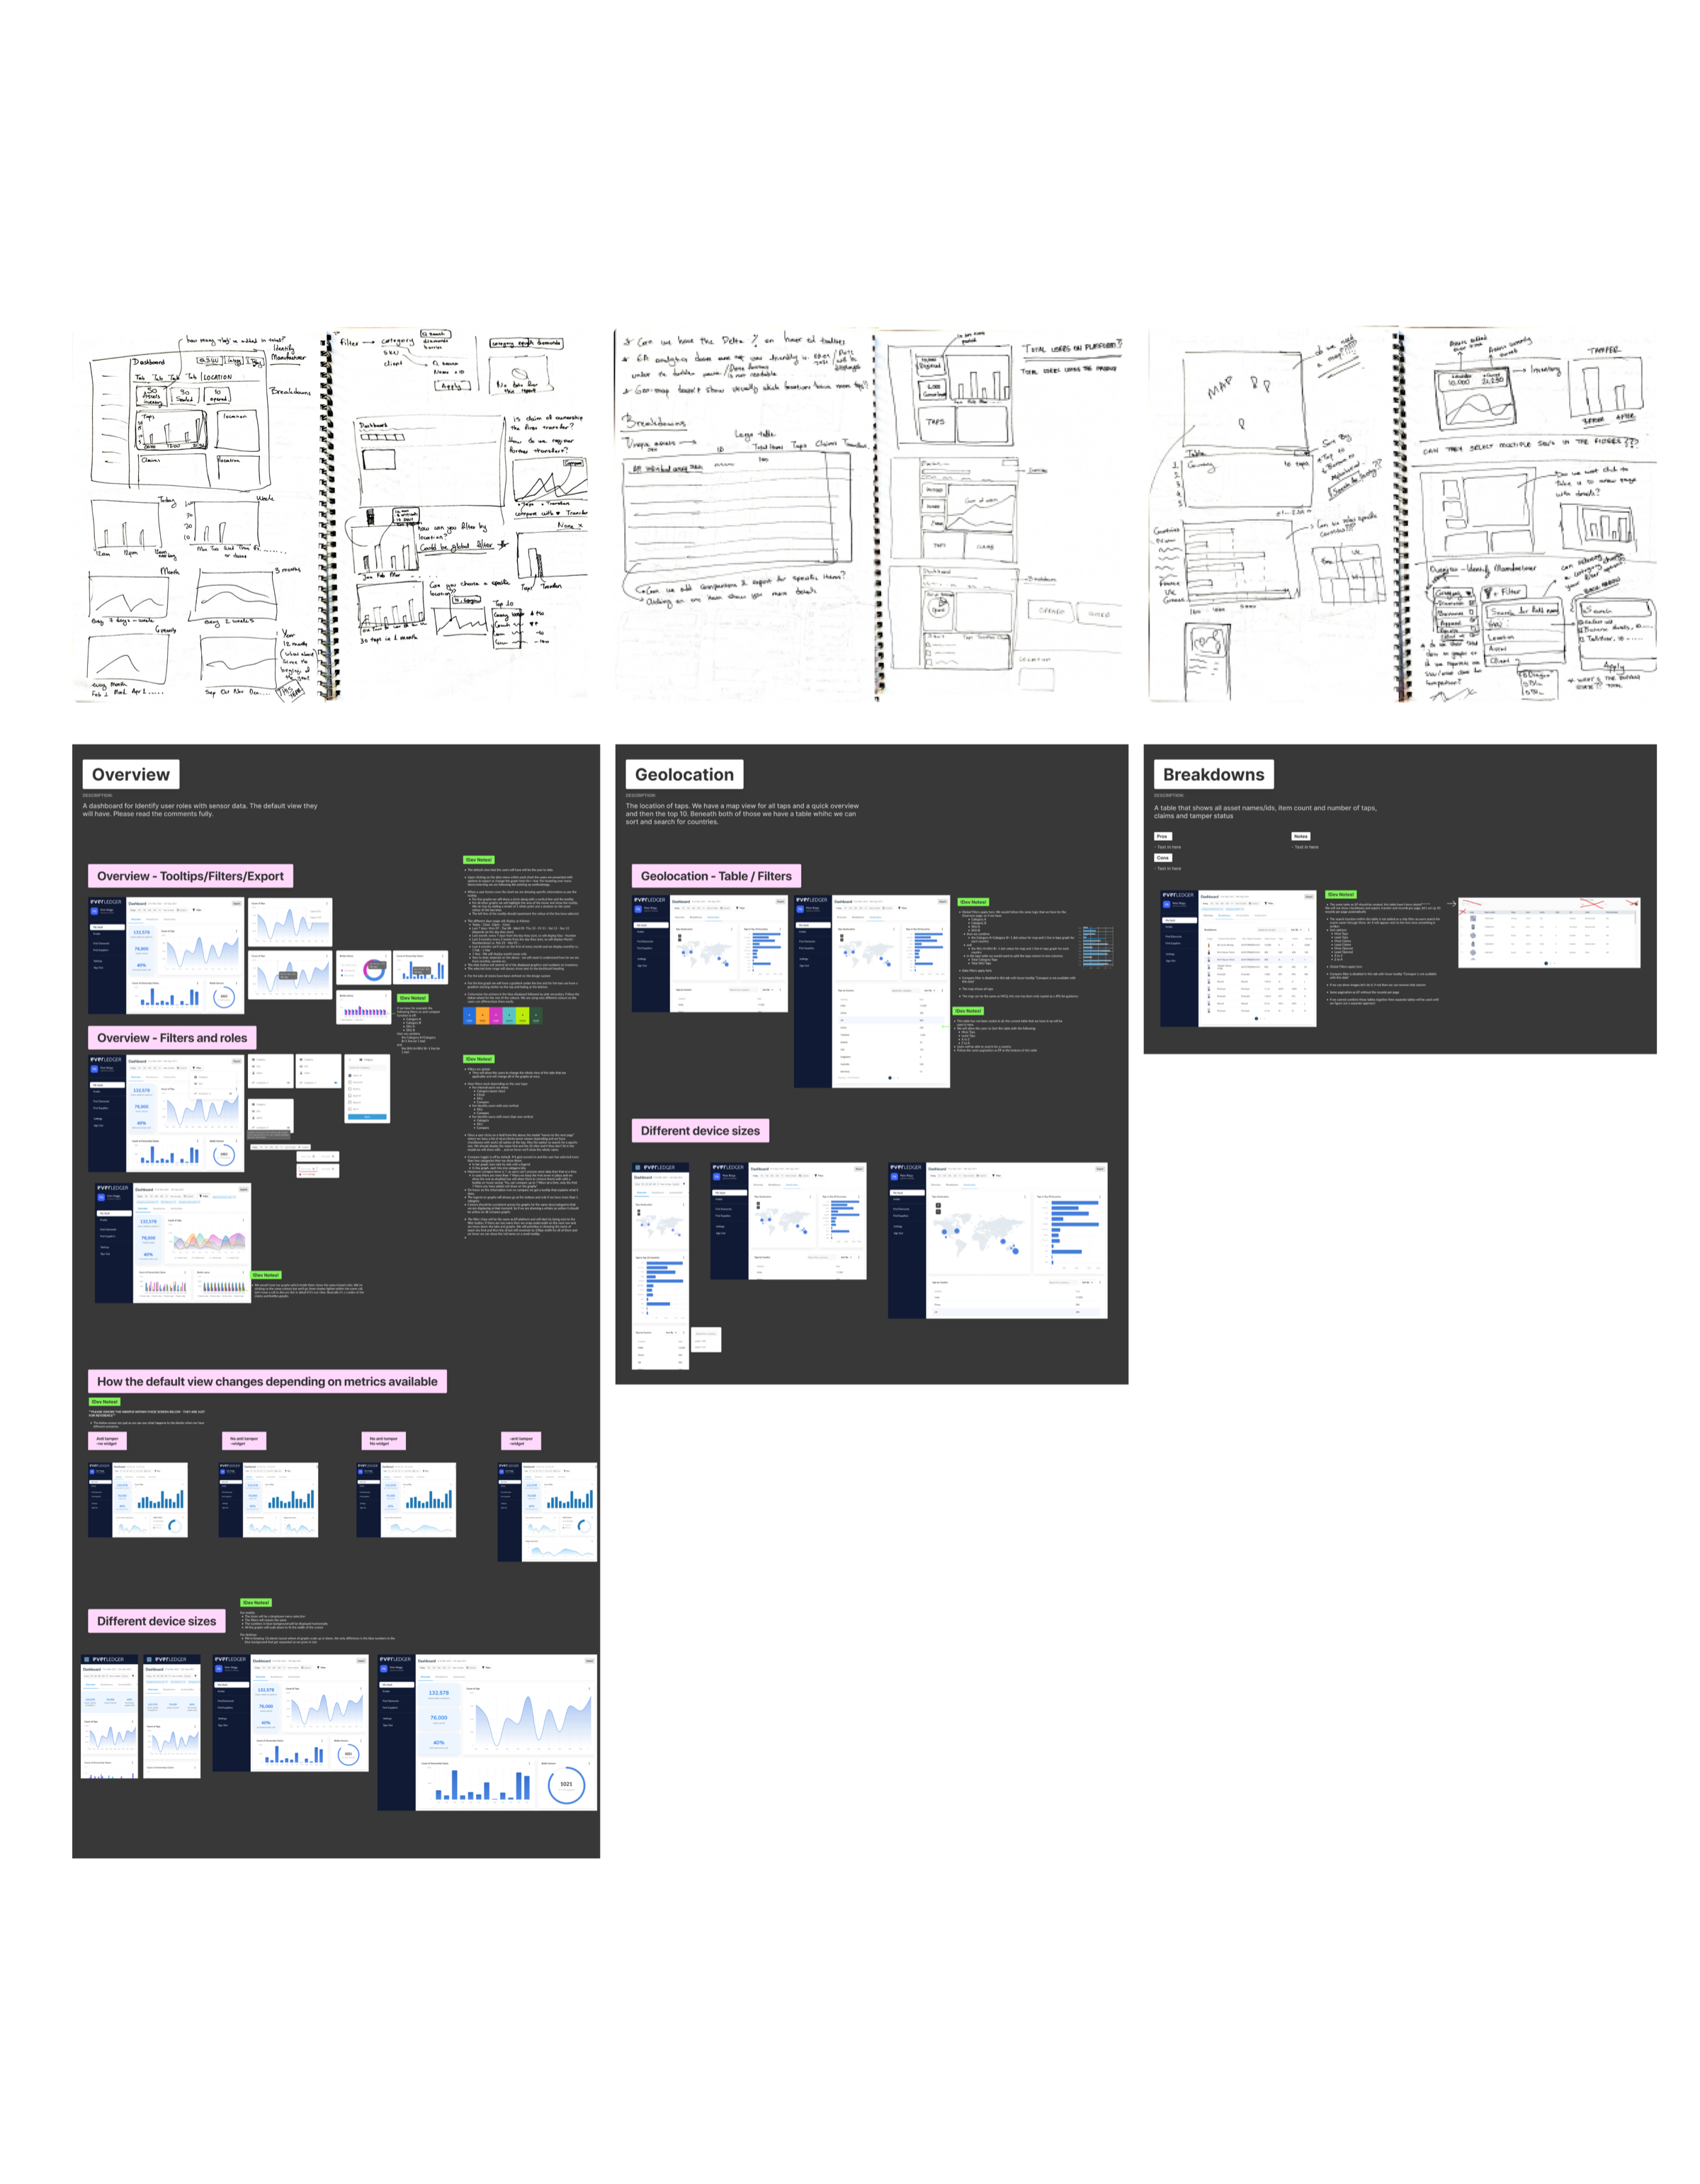
Sketching solutions
As the project progressed, I began exploring different layouts and modular widgets for the analytics dashboard. I started sketching out ideas using pen and paper to quickly iterate on different options. To ensure feasibility and collaboration with the development team, I kept in constant communication with them throughout the sketching phase.
Once the sketches had been refined and validated, I began designing in Figma and added finer details to the dashboard. To streamline my workflow and increase productivity, I also made use of various Figma plugins to create custom diagrams and visuals in the most efficient way possible.
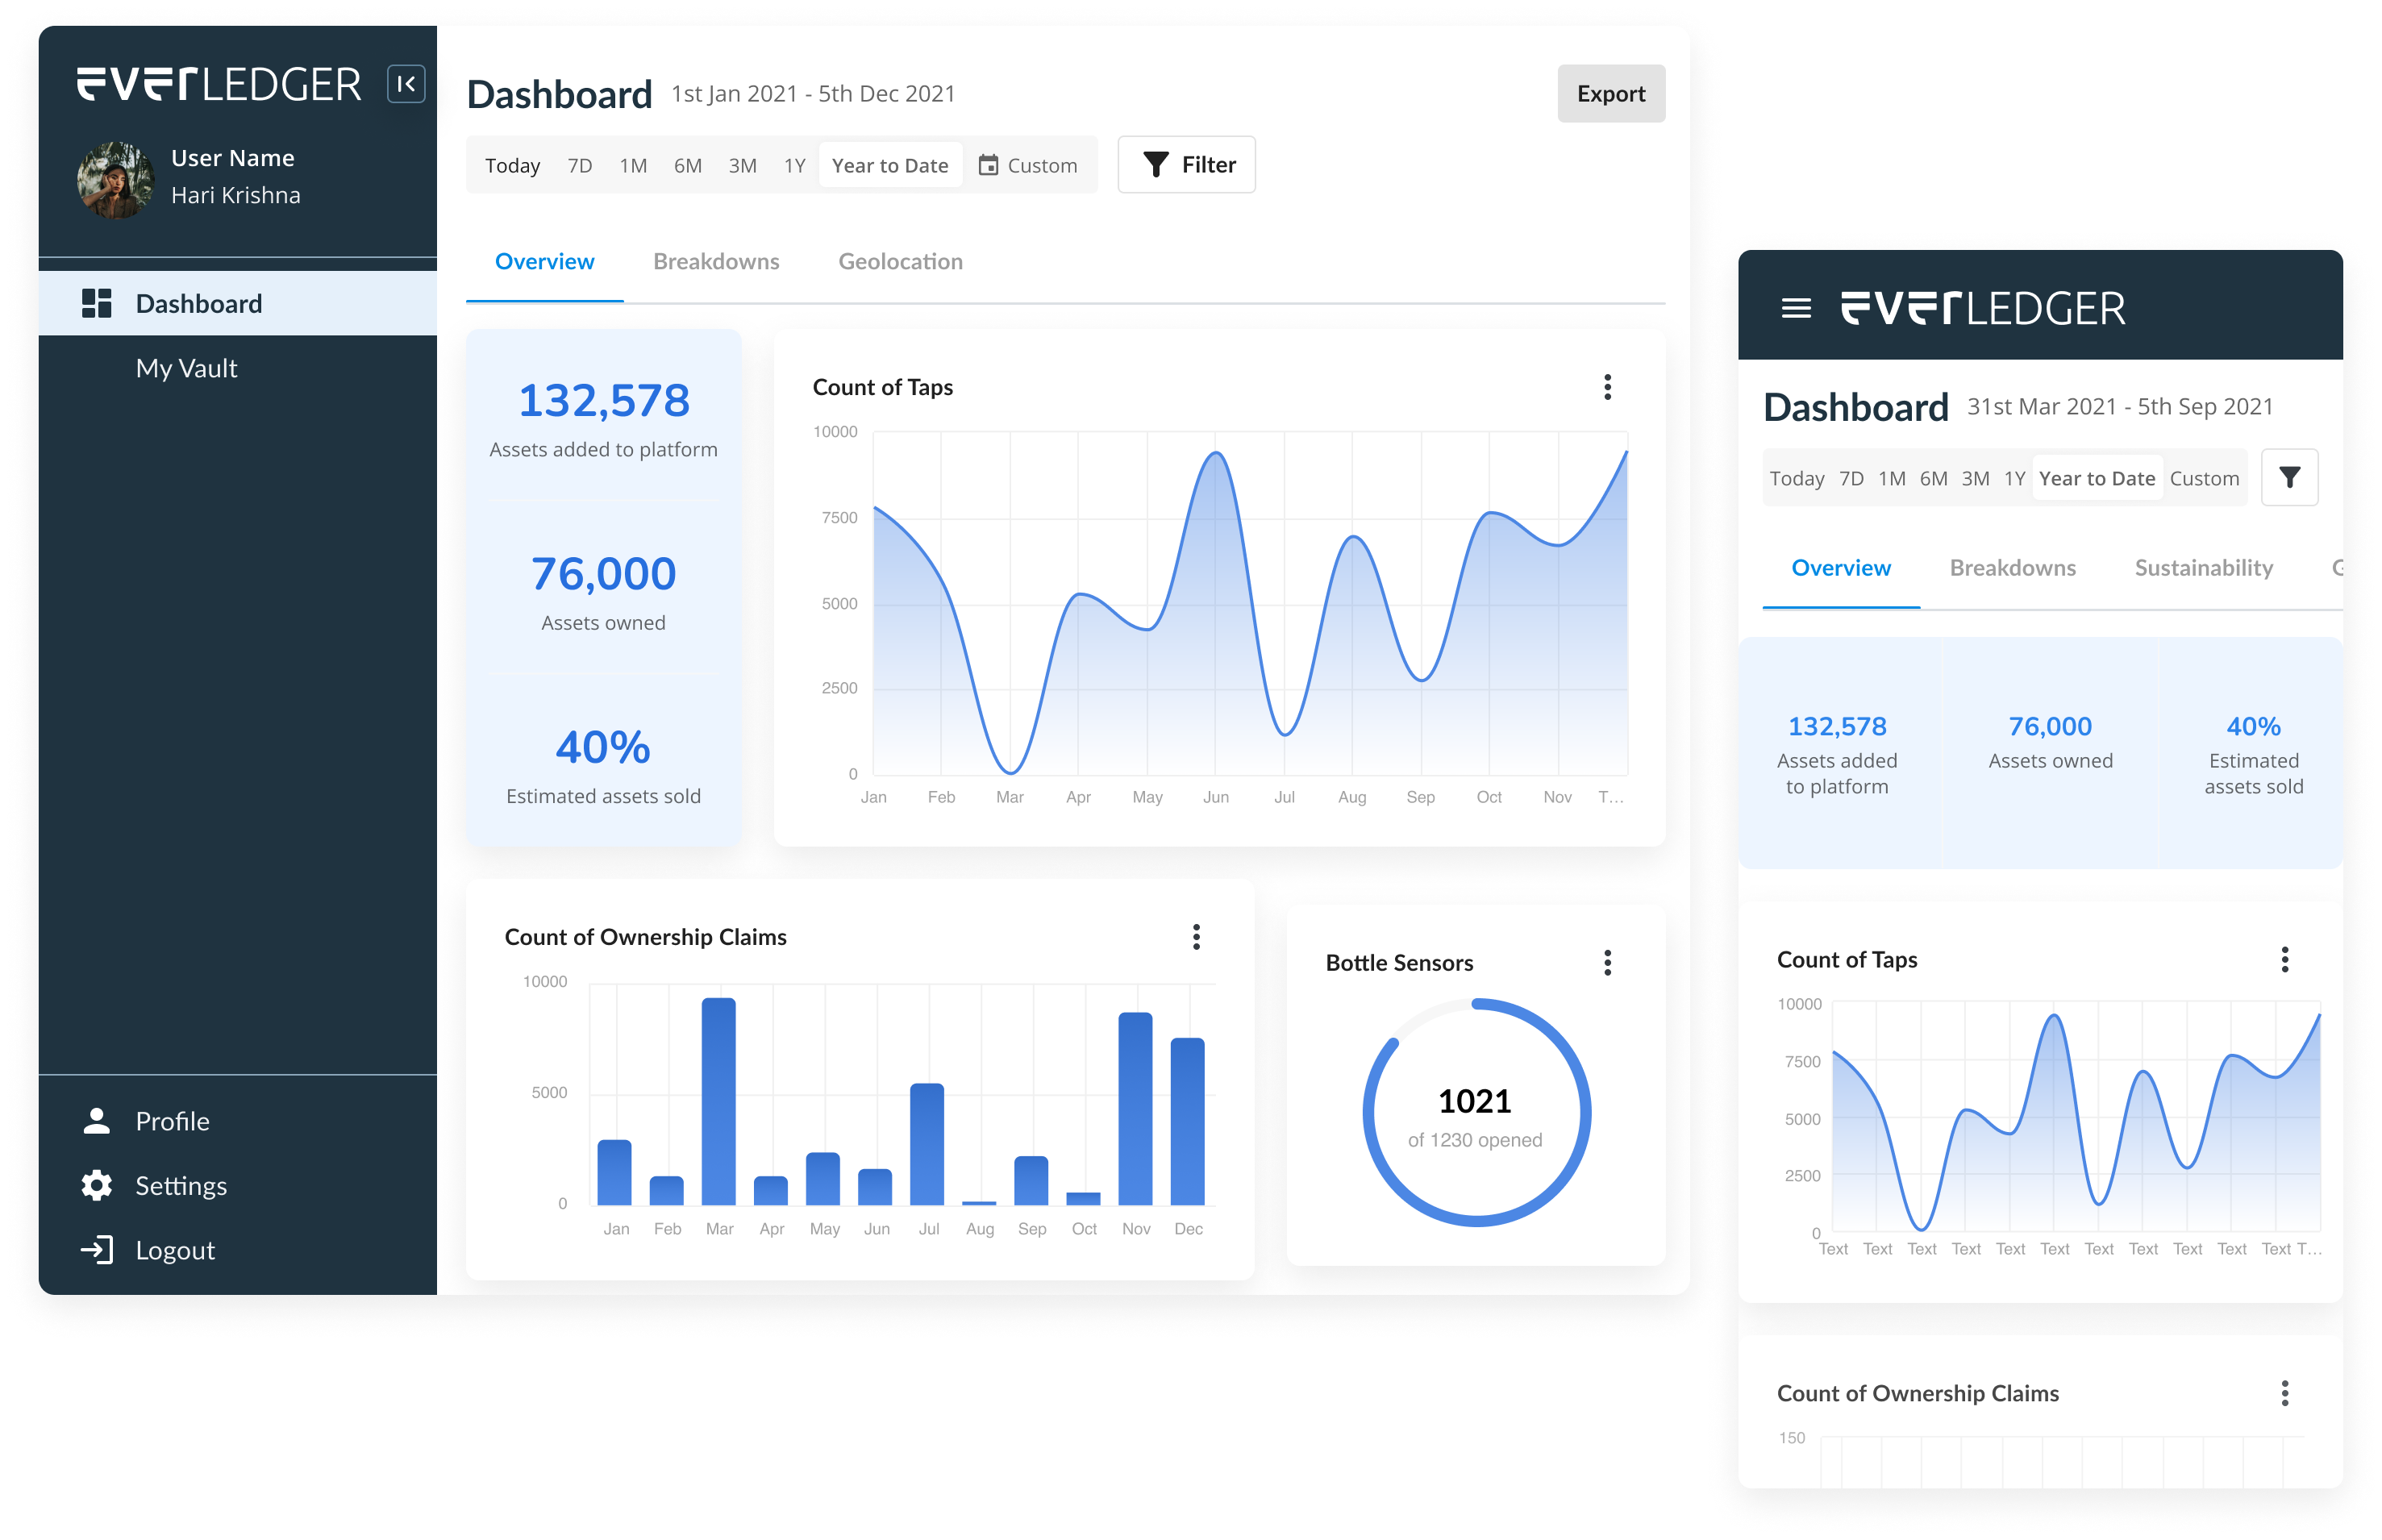
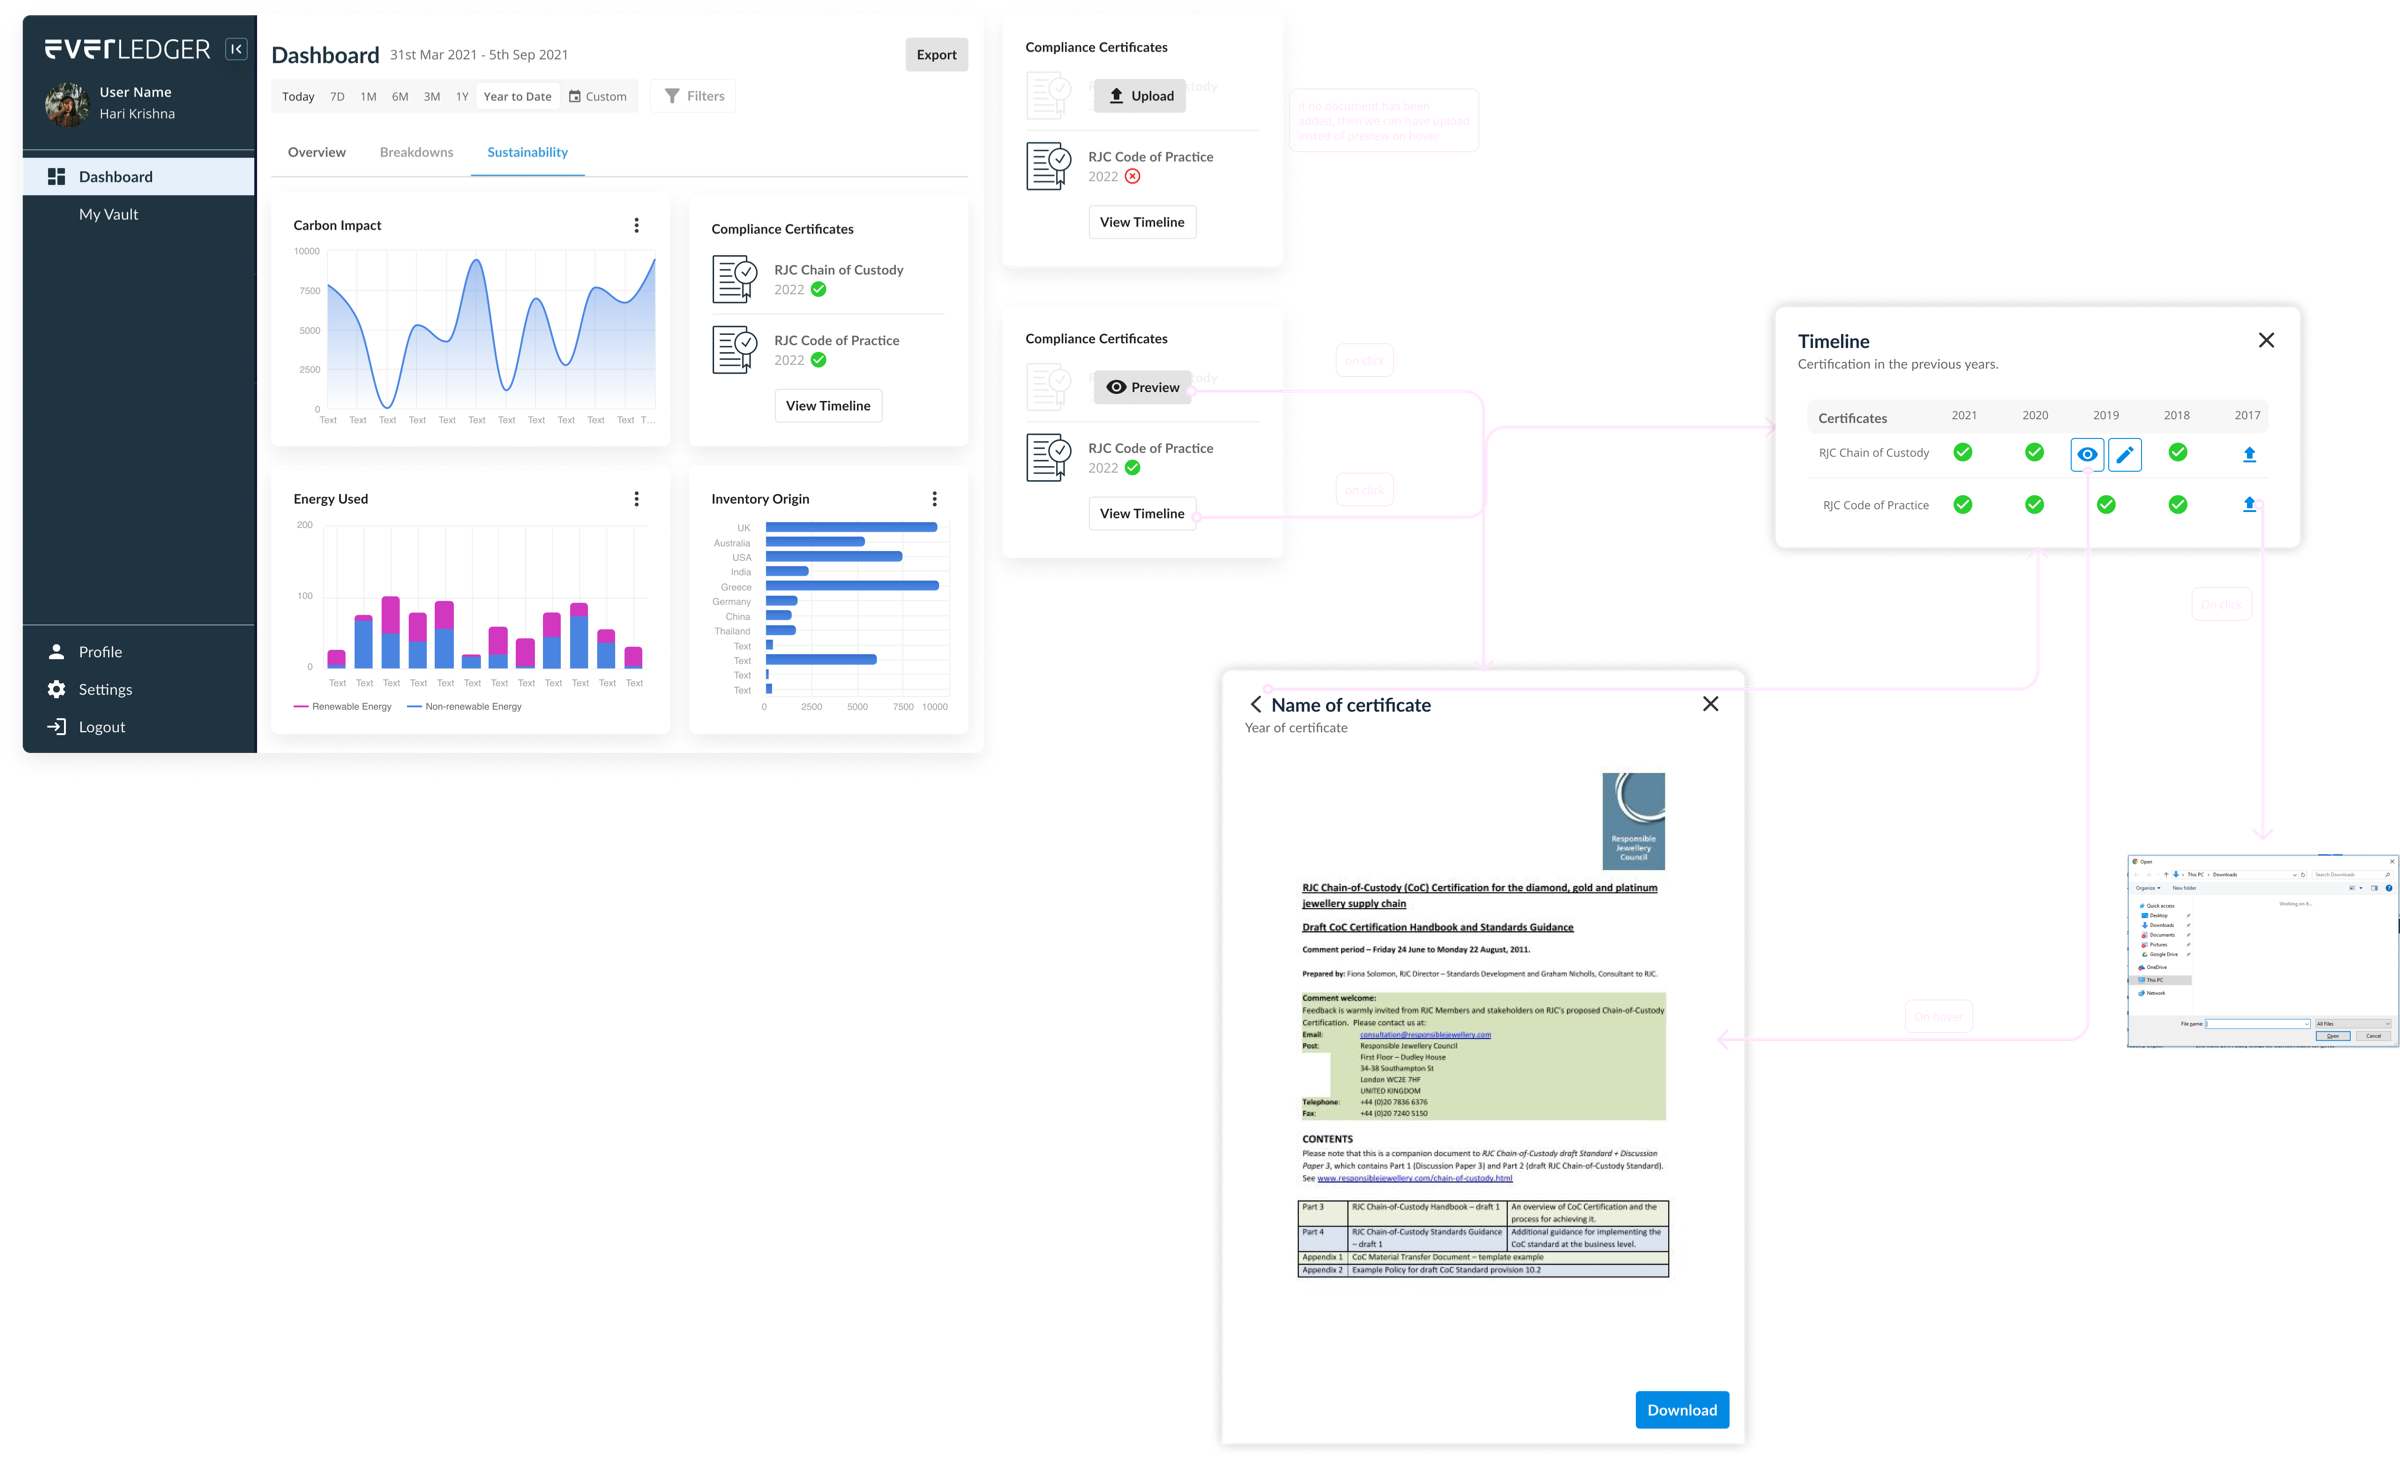
High-fidelity designs
I delivered the final responsive designs for all required users, along with detailed specifications, and held a workshop with the developers to walk them through the screens. Additionally, I provided support during implementation and performed design quality assurance to ensure that the final product matched the original design.
Although we were unable to conduct user testing before development due to time constraints, we created a research plan to conduct usability testing in the next phase to ensure that the final product was user-friendly and intuitive.
Conclusion
By focusing on the user experience and leveraging best practices in information architecture, data visualization, and user interface design, we were able to create a dashboard that provided real value to both internal stakeholders and external users.
One of the key learnings from this project is the importance of understanding the users’ goals and motivations when designing a data visualization tool. Keep remembering that users are not just looking for data, but for actionable insights that they can use to make informed decisions.